

one big file - Social Watch
one big file - Social Watch
one big file - Social Watch

You also want an ePaper? Increase the reach of your titles
YUMPU automatically turns print PDFs into web optimized ePapers that Google loves.
Missing Targets: An alternative MDG midterm report<br />
between income level and education performance.<br />
Thus, poor countries tend to have lower EDI scores<br />
while the rich tend to score high.<br />
The same pattern is observed in the Philippines.<br />
The government’s midterm report on the MDG “noted<br />
that participation rates in primary education by region<br />
correlate inversely with the incidence rates for food and<br />
overall poverty.” The same report also noted that regions<br />
with low poverty incidence tend to have high cohort<br />
survival and completion rates and low dropout rates.<br />
It is interesting to note that participation rates in<br />
primary education by region are inversely correlated<br />
with the incidence rates for food and overall poverty.<br />
The regions with highest participation rates showed<br />
the lowest poverty incidence rates, namely, the NCR,<br />
Ilocos Region, Cagayan Valley, Central Luzon and<br />
Calabarzon. Accordingly, these five regions had the<br />
highest cohort survival rates and lowest dropout rates.<br />
The observed correlations among these variables suggest<br />
that investment in primary education is promising<br />
for poverty reduction. The above correlations support<br />
the importance of adopting progressive approaches in<br />
fighting poverty and investing in primary education.<br />
Such an approach raises the likelihood of accelerating<br />
the realization of MDG targets.<br />
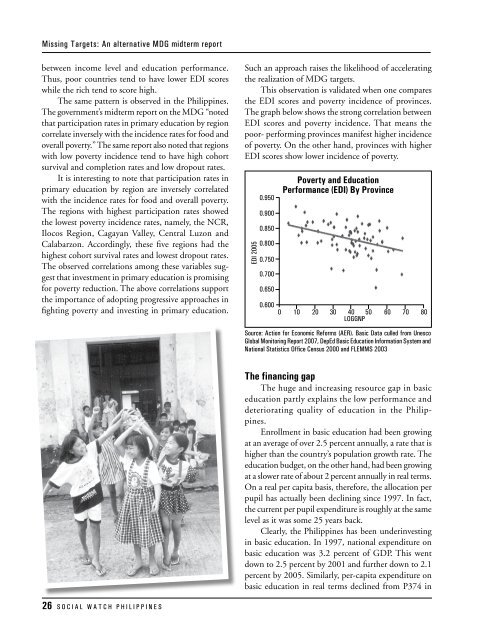
This observation is validated when <strong>one</strong> compares<br />
the EDI scores and poverty incidence of provinces.<br />
The graph below shows the strong correlation between<br />
EDI scores and poverty incidence. That means the<br />
poor- performing provinces manifest higher incidence<br />
of poverty. On the other hand, provinces with higher<br />
EDI scores show lower incidence of poverty.<br />
EDI 2005<br />
0.950<br />
0.900<br />
0.850<br />
0.800<br />
0.750<br />
0.700<br />
0.650<br />
0.600<br />
0<br />
Poverty and Education<br />
Performance (EDI) By Province<br />
10 20 30 40 50 60 70 80<br />
LOGGNP<br />
Source: Action for Economic Reforms (AER). Basic Data culled from Unesco<br />
Global Monitoring Report 2007, DepEd Basic Education Information System and<br />
National Statistics Office Census 2000 and FLEMMS 2003<br />
The financing gap<br />
The huge and increasing resource gap in basic<br />
education partly explains the low performance and<br />
deteriorating quality of education in the Philippines.<br />
Enrollment in basic education had been growing<br />
at an average of over 2.5 percent annually, a rate that is<br />
higher than the country’s population growth rate. The<br />
education budget, on the other hand, had been growing<br />
at a slower rate of about 2 percent annually in real terms.<br />
On a real per capita basis, therefore, the allocation per<br />
pupil has actually been declining since 1997. In fact,<br />
the current per pupil expenditure is roughly at the same<br />
level as it was some 25 years back.<br />
Clearly, the Philippines has been underinvesting<br />
in basic education. In 1997, national expenditure on<br />
basic education was 3.2 percent of GDP. This went<br />
down to 2.5 percent by 2001 and further down to 2.1<br />
percent by 2005. Similarly, per-capita expenditure on<br />
basic education in real terms declined from P374 in<br />
26 S O C I A L W A T C H P H I L I P P I N E S


