CONFLICT BAROMETER 2008
CONFLICT BAROMETER 2008
CONFLICT BAROMETER 2008

Create successful ePaper yourself
Turn your PDF publications into a flip-book with our unique Google optimized e-Paper software.
2 Conflict Barometer <strong>2008</strong><br />
tion)]. One conflict in the Americas was considered to<br />
have ended in <strong>2008</strong>. In Asia and Oceania, two conflicts<br />
had ended in 2007, i.e. Singapore (Malays) and Vietnam<br />
(KKNLF). In the Middle East and Maghreb, no conflict<br />
ended either in 2007 or <strong>2008</strong>, and no new conflict broke<br />
out in <strong>2008</strong>.<br />
In order to reveal a long-term trend, the five intensity<br />
levels are categorized into three groups: The two nonviolent<br />
levels are summarized as low intensity, crises as<br />
medium intensity, and severe crises and wars as conflicts<br />
of high intensity. The graph below also displays<br />
the total number of conflicts observed. As the graph<br />
shows, the number of conflicts observed per year has<br />
risen more or less continuously. Most of the conflicts are<br />
low-intensity conflicts. Regarding high-intensity conflicts,<br />
a continuous and - for the most part - regular increase,<br />
interrupted by minor phases of deescalation is evident.<br />
number of conflicts<br />
400<br />
350<br />
300<br />
250<br />
200<br />
150<br />
100<br />
50<br />
0<br />
Global Conflicts of low, medium and high Intensity<br />
1945 to <strong>2008</strong><br />
low intensity<br />
medium intensity<br />
high intensity<br />
Total<br />
........ .... ........................................................................................................................................................<br />
1945<br />
1950<br />
1955<br />
1960<br />
1965<br />
1970<br />
The all-time high was reached with 49 high intensity<br />
conflicts in 1992, shortly after the collapse of the Soviet<br />
Union. After a spectacular drop to only 30 in 2005,<br />
the number of highly violent conflicts rose again to 36<br />
in 2006, then decreased to 32 in 2007, and finally rose<br />
again to 39 in <strong>2008</strong> – the highest number since 2004.<br />
The number of crises had soared to previously unknown<br />
heights in recent years, peaking with 113 in 2005. However,<br />
this trend was reversed in 2006, with the number<br />
of crises decreasing again, now for the third year. Nevertheless,<br />
the number of crises remained on a very high<br />
level.<br />
Analysis intrastate - interstate<br />
With 254 intrastate and 91 interstate cases, respectively,<br />
more than two thirds of the conflicts monitored in <strong>2008</strong><br />
were internal conflicts, as in the past years.<br />
As only eight out of 91 of the interstate conflicts were<br />
conducted with the use of violence, intrastate conflicts<br />
accounted for the vast majority of violent and especially<br />
highly violent conflicts.<br />
While 88 of the 95 crises were intrastate, seven interstate<br />
crises were observed: Armenia - Azerbaijan, Chad<br />
- Sudan, Eritrea - Djibouti, Israel - Lebanon,<br />
1975<br />
1980<br />
1985<br />
1990<br />
1995<br />
2000<br />
2005<br />
.<br />
.<br />
.<br />
number of conflicts<br />
110<br />
100<br />
90<br />
80<br />
70<br />
60<br />
50<br />
40<br />
30<br />
20<br />
10<br />
0<br />
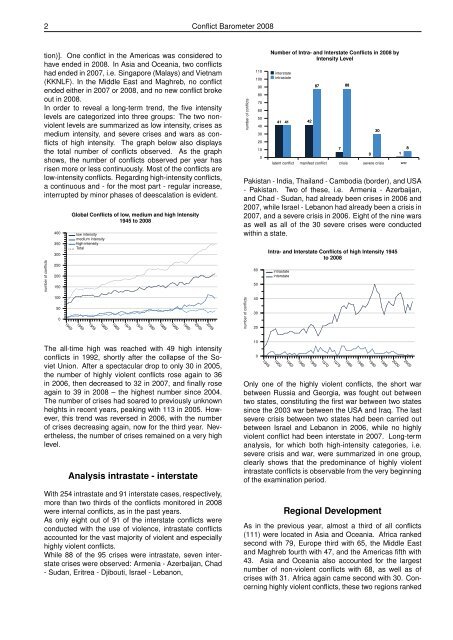
Number of Intra- and Interstate Conflicts in <strong>2008</strong> by<br />
Intensity Level<br />
interstate<br />
intrastate<br />
41 41<br />
42<br />
87 88<br />
7<br />
30<br />
0 1<br />
latent conflict manifest conflict crisis severe crisis war<br />
Pakistan - India, Thailand - Cambodia (border), and USA<br />
- Pakistan. Two of these, i.e. Armenia - Azerbaijan,<br />
and Chad - Sudan, had already been crises in 2006 and<br />
2007, while Israel - Lebanon had already been a crisis in<br />
2007, and a severe crisis in 2006. Eight of the nine wars<br />
as well as all of the 30 severe crises were conducted<br />
within a state.<br />
number of conflicts<br />
60<br />
50<br />
40<br />
30<br />
20<br />
10<br />
0<br />
1945<br />
Intra- and Interstate Conflicts of high Intensity 1945<br />
to <strong>2008</strong><br />
intrastate<br />
interstate<br />
1950<br />
1955<br />
1960<br />
1965<br />
1970<br />
1975<br />
Only one of the highly violent conflicts, the short war<br />
between Russia and Georgia, was fought out between<br />
two states, constituting the first war between two states<br />
since the 2003 war between the USA and Iraq. The last<br />
severe crisis between two states had been carried out<br />
between Israel and Lebanon in 2006, while no highly<br />
violent conflict had been interstate in 2007. Long-term<br />
analysis, for which both high-intensity categories, i.e.<br />
severe crisis and war, were summarized in one group,<br />
clearly shows that the predominance of highly violent<br />
intrastate conflicts is observable from the very beginning<br />
of the examination period.<br />
1980<br />
1985<br />
1990<br />
Regional Development<br />
As in the previous year, almost a third of all conflicts<br />
(111) were located in Asia and Oceania. Africa ranked<br />
second with 79, Europe third with 65, the Middle East<br />
and Maghreb fourth with 47, and the Americas fifth with<br />
43. Asia and Oceania also accounted for the largest<br />
number of non-violent conflicts with 68, as well as of<br />
crises with 31. Africa again came second with 30. Concerning<br />
highly violent conflicts, these two regions ranked<br />
1995<br />
2000<br />
8<br />
2005<br />
.<br />
.