Real time PCR - European Pharmaceutical Review
Real time PCR - European Pharmaceutical Review
Real time PCR - European Pharmaceutical Review

You also want an ePaper? Increase the reach of your titles
YUMPU automatically turns print PDFs into web optimized ePapers that Google loves.
THERMAL ANALYSIS ISSUE 2009<br />
system, TA Instruments LLC) was<br />
employed to quantify the extent of<br />
any disorder.<br />
The use of IGPC for amorphous<br />
content has become popular and the<br />
technique offers many advantages 6 .<br />
Briefly, in a gas-perfusion experiment<br />
the sample is held in an ampoule<br />
while a carrier gas flows over the<br />
sample. The relative vapour pressure<br />
(RVP) of the gas is controlled by<br />
proportional mixing of dry (0% RVP)<br />
and wet (100% RVP) gas streams.<br />
The system can thus be programmed<br />
to follow a specific RVP program.<br />
IGPC is convenient for quantifying<br />
amorphous material; the sample is<br />
held dry and allowed to reach thermal<br />
equilibrium. The RVP is then<br />
increased (usually to ca. 90%) which<br />
results in solvent uptake by the<br />
sample. This plasticises the sample,<br />
lowering the glass transition<br />
temperature and causing<br />
recrystallisation. The RVP is then<br />
returned to zero, which dries the<br />
sample. Subtraction of the areas<br />
under the wetting and drying peaks<br />
thus indicates the presence of any<br />
irreversible events.<br />
A calibration curve of amorphous<br />
content versus heat of crystallisation<br />
was prepared by mixing proportional<br />
mass ratios of the crystalline and<br />
amorphous SS samples. Full<br />
experimental details are available<br />
upon request.<br />
The calibration curve obtained of<br />
SS amorphous content versus<br />
measured heat was linear (see<br />
Figure 2 on page 29). It was thus<br />
possible to use the data to quantify<br />
extents of disorder in milled SS<br />
samples, although it should be noted<br />
that the use of this type of calibration<br />
curve has some limitations 6,7 .<br />
Principally, the material used to<br />
prepare the calibration curve (a<br />
mixture of wholly amorphous and<br />
wholly crystalline particles) is<br />
physically distinct from the study<br />
material, which in this case will have<br />
disordered regions (that is, a<br />
combination of crystal dislocations<br />
and amorphous areas) forming a<br />
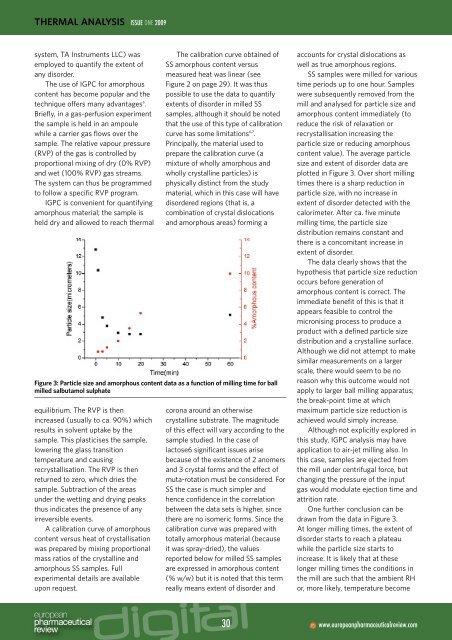
Figure 3: Particle size and amorphous content data as a function of milling <strong>time</strong> for ball<br />
milled salbutamol sulphate<br />
corona around an otherwise<br />
crystalline substrate. The magnitude<br />
of this effect will vary according to the<br />
sample studied. In the case of<br />
lactose6 significant issues arise<br />
because of the existence of 2 anomers<br />
and 3 crystal forms and the effect of<br />
muta-rotation must be considered. For<br />
SS the case is much simpler and<br />
hence confidence in the correlation<br />
between the data sets is higher, since<br />
there are no isomeric forms. Since the<br />
calibration curve was prepared with<br />
totally amorphous material (because<br />
it was spray-dried), the values<br />
reported below for milled SS samples<br />
are expressed in amorphous content<br />
(% w/w) but it is noted that this term<br />
really means extent of disorder and<br />
accounts for crystal dislocations as<br />
well as true amorphous regions.<br />
SS samples were milled for various<br />
<strong>time</strong> periods up to one hour. Samples<br />
were subsequently removed from the<br />
mill and analysed for particle size and<br />
amorphous content immediately (to<br />
reduce the risk of relaxation or<br />
recrystallisation increasing the<br />
particle size or reducing amorphous<br />
content value). The average particle<br />
size and extent of disorder data are<br />
plotted in Figure 3. Over short milling<br />
<strong>time</strong>s there is a sharp reduction in<br />
particle size, with no increase in<br />
extent of disorder detected with the<br />
calorimeter. After ca. five minute<br />
milling <strong>time</strong>, the particle size<br />
distribution remains constant and<br />
there is a concomitant increase in<br />
extent of disorder.<br />
The data clearly shows that the<br />
hypothesis that particle size reduction<br />
occurs before generation of<br />
amorphous content is correct. The<br />
immediate benefit of this is that it<br />
appears feasible to control the<br />
micronising process to produce a<br />
product with a defined particle size<br />
distribution and a crystalline surface.<br />
Although we did not attempt to make<br />
similar measurements on a larger<br />
scale, there would seem to be no<br />
reason why this outcome would not<br />
apply to larger ball milling apparatus;<br />
the break-point <strong>time</strong> at which<br />
maximum particle size reduction is<br />
achieved would simply increase.<br />
Although not explicitly explored in<br />
this study, IGPC analysis may have<br />
application to air-jet milling also. In<br />
this case, samples are ejected from<br />
the mill under centrifugal force, but<br />
changing the pressure of the input<br />
gas would modulate ejection <strong>time</strong> and<br />
attrition rate.<br />
One further conclusion can be<br />
drawn from the data in Figure 3.<br />
At longer milling <strong>time</strong>s, the extent of<br />
disorder starts to reach a plateau<br />
while the particle size starts to<br />
increase. It is likely that at these<br />
longer milling <strong>time</strong>s the conditions in<br />
the mill are such that the ambient RH<br />
or, more likely, temperature become<br />
30<br />
www.europeanpharmaceuticalreview.com