Real time PCR - European Pharmaceutical Review
Real time PCR - European Pharmaceutical Review
Real time PCR - European Pharmaceutical Review

You also want an ePaper? Increase the reach of your titles
YUMPU automatically turns print PDFs into web optimized ePapers that Google loves.
SUBSCRIBE<br />
ISSUE<br />
2009 q<strong>PCR</strong><br />
Figure 4: Total fluorescence and transformation. At each cycles of the <strong>PCR</strong>, total<br />
florescence is measured across a large range of wavelength (top left corner, individual<br />
traces for fluorescence measures at four different cycles) at the end of the annealing /<br />
elongation phase (59oC) from cycle 5 till cycle 40 (bottom left corner). Individual traces<br />
indicate the three main components in this example. The pick to the right represents the<br />
buffer dye, ROX, which remain stable with <strong>time</strong>. The pick to the left increase with <strong>time</strong><br />
and represents the amount of fluorescence release specifically at each cycle when<br />
quencher dye (TAMRA) is cleaved away from the reporter dye (FAM in this example).<br />
Total fluorescence traces are then transformed into individual fluorescence components<br />
(top right corner) where specific fluorescence are followed with <strong>time</strong> trough the<br />
progression of the <strong>PCR</strong>. Here, ROX fluorescence is stable (yellow line) indicating a<br />
reaction with no mis-happening. The TAMRA fluorescence (green line) represents the<br />
quencher and is also stable across the reaction. FAM (red line) increases with <strong>time</strong>,<br />
representing the <strong>PCR</strong> product. Finally, the multi-components analysis is transformed into<br />
an amplification plot (bottom right corner) as described in more details in Figure 5.<br />
phase of the <strong>PCR</strong> (linear part of the<br />
Log-fluorescence curve). As a Ct is<br />
proportional to the logarithm of the<br />
initial amount of target in a sample,<br />
the relative concentration of one<br />
target with respect to another is<br />
reflected in the difference in cycle<br />
number (ΔCt = Ct sample – Ct reference )<br />
necessary to achieve the same level<br />
of fluorescence. A glossary of real<br />
<strong>time</strong> <strong>PCR</strong> terminology is available on<br />
the web. The main benefit of real <strong>time</strong><br />
<strong>PCR</strong> which made its popularity<br />
(in addition to the fact that the assay<br />
last about two hours) is that its<br />
sensitivity usually allows detection<br />
over a 6 to 7 log scale (see Figure 6<br />
on page 10). Furthermore, two<br />
reactions can be multiplexed in the<br />
same tube allowing a house-keeping<br />
gene to be measured under the exact<br />
same conditions as the test gene.<br />
In addition to real-<strong>time</strong> <strong>PCR</strong> as<br />
such, which allows quantification of<br />
<strong>PCR</strong> products at each cycle of the<br />
reaction, an “end point assay” ((see<br />
Figure 7 on page 10) most often<br />
referred to as allelic discrimination<br />
cycle across the whole wavelength<br />
range (see Figure 4). The algorithm<br />
within the real <strong>time</strong> <strong>PCR</strong> software<br />
then calculates the specific<br />
contribution to the total fluorescence<br />
of the reporting die, the quencher and<br />
the passive reference (see Figure 4).<br />
This is then transformed in an<br />
amplification plot where fluorescence<br />
is represented at each cycle of the<br />
<strong>PCR</strong> (see Figure 5). During the initial<br />
cycles, the fluorescence signal<br />
emitted by the die (either by the<br />
reporter of a TaqMan probe or by<br />
SYBR-green I) is usually too weak to<br />
register above background. During<br />
the exponential phase of the <strong>PCR</strong>, the<br />
fluorescence doubled at each cycle.<br />
A precise fluorescence doubling at<br />
each cycle is an important indicator<br />
of a well-optimised assay. After<br />
30-35 cycles, the intensity of<br />
fluorescent signal usually began to<br />
plateau, indicating that the <strong>PCR</strong> had<br />
reached a saturation status. Cts are<br />
best recorded during the exponential<br />
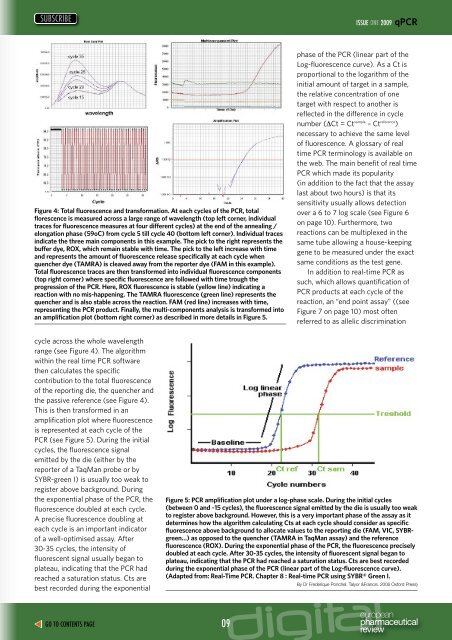
Figure 5: <strong>PCR</strong> amplification plot under a log-phase scale. During the initial cycles<br />
(between 0 and ~15 cycles), the fluorescence signal emitted by the die is usually too weak<br />
to register above background. However, this is a very important phase of the assay as it<br />
determines how the algorithm calculating Cts at each cycle should consider as specific<br />
fluorescence above background to allocate values to the reporting die (FAM, VIC, SYBRgreen…)<br />
as opposed to the quencher (TAMRA in TaqMan assay) and the reference<br />
fluorescence (ROX). During the exponential phase of the <strong>PCR</strong>, the fluorescence precisely<br />
doubled at each cycle. After 30-35 cycles, the intensity of fluorescent signal began to<br />
plateau, indicating that the <strong>PCR</strong> had reached a saturation status. Cts are best recorded<br />
during the exponential phase of the <strong>PCR</strong> (linear part of the Log-fluorescence curve).<br />
(Adapted from: <strong>Real</strong>-Time <strong>PCR</strong>. Chapter 8 : <strong>Real</strong>-<strong>time</strong> <strong>PCR</strong> using SYBR® Green I.<br />
By Dr Frederique Ponchel. Talyor &Francis. 2006 Oxford Press)<br />
GO TO CONTENTS PAGE 09