Caboolture Region Water Quality Study - Moreton Bay Regional ...
Caboolture Region Water Quality Study - Moreton Bay Regional ...
Caboolture Region Water Quality Study - Moreton Bay Regional ...

Create successful ePaper yourself
Turn your PDF publications into a flip-book with our unique Google optimized e-Paper software.
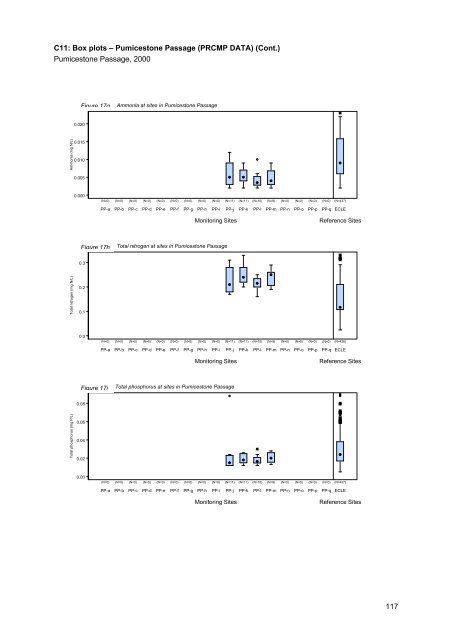
C11: Box plots – Pumicestone Passage (PRCMP DATA) (Cont.)<br />
Pumicestone Passage, 2000<br />
Figure Figure 17g7g Ammonia at sites in Pumicestone Passage<br />
0.020<br />
Ammonia (mg N/L)<br />
0.015<br />
0.010<br />
0.005<br />
0.000<br />
(N=0) (N=0) (N=0) (N=0) (N=0) (N=0) (N=0) (N=0) (N=0) (N=11) (N=11) (N=10) (N=9) (N=0) (N=0) (N=0) (N=0) (N=437)<br />
PP-a PP-b PP-c PP-d PP-e PP-f PP-g PP-h PP-i PP-j PP-k PP-l PP-m PP-n PP-o PP-p PP-q ECLE<br />
Monitoring Sites<br />
Reference Sites<br />
Figure Figure 17h7h Total nitrogen at sites in Pumicestone Passage<br />
0.3<br />
Total nitrogen (mg N/L)<br />
0.2<br />
0.1<br />
0.0<br />
(N=0) (N=0) (N=0) (N=0) (N=0) (N=0) (N=0) (N=0) (N=0) (N=11) (N=11) (N=10) (N=9) (N=0) (N=0) (N=0) (N=0) (N=436)<br />
PP-a PP-b PP-c PP-d PP-e PP-f PP-g PP-h PP-i PP-j PP-k PP-l PP-m PP-n PP-o PP-p PP-q ECLE<br />
Monitoring Sites<br />
Reference Sites<br />
Figure Figure 17i7i<br />
Total phosphorus at sites in Pumicestone Passage<br />
0.08<br />
Total phosphorus (mg P/L)<br />
0.06<br />
0.04<br />
0.02<br />
0.00<br />
(N=0) (N=0) (N=0) (N=0) (N=0) (N=0) (N=0) (N=0) (N=0) (N=11) (N=11) (N=10) (N=9) (N=0) (N=0) (N=0) (N=0) (N=437)<br />
PP-a PP-b PP-c PP-d PP-e PP-f PP-g PP-h PP-i PP-j PP-k PP-l PP-m PP-n PP-o PP-p PP-q ECLE<br />
Monitoring Sites<br />
Reference Sites<br />
117

![Kumbartcho Brochure [PDF 540KB] - Moreton Bay Regional Council](https://img.yumpu.com/47220970/1/190x101/kumbartcho-brochure-pdf-540kb-moreton-bay-regional-council.jpg?quality=85)