Caboolture Region Water Quality Study - Moreton Bay Regional ...
Caboolture Region Water Quality Study - Moreton Bay Regional ...
Caboolture Region Water Quality Study - Moreton Bay Regional ...

Create successful ePaper yourself
Turn your PDF publications into a flip-book with our unique Google optimized e-Paper software.
<strong>Caboolture</strong> <strong>Water</strong> <strong>Quality</strong> <strong>Study</strong><br />
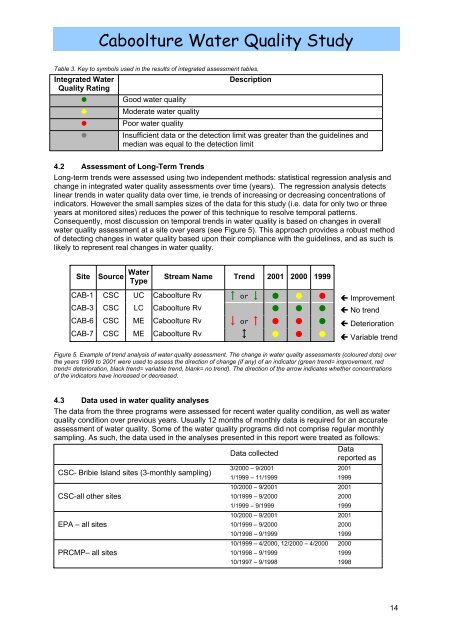
Table 3. Key to symbols used in the results of integrated assessment tables.<br />
Integrated <strong>Water</strong><br />
<strong>Quality</strong> Rating<br />
<br />
<br />
<br />
<br />
Good water quality<br />
Moderate water quality<br />
Poor water quality<br />
Description<br />
Insufficient data or the detection limit was greater than the guidelines and<br />
median was equal to the detection limit<br />
4.2 Assessment of Long-Term Trends<br />
Long-term trends were assessed using two independent methods: statistical regression analysis and<br />
change in integrated water quality assessments over time (years). The regression analysis detects<br />
linear trends in water quality data over time, ie trends of increasing or decreasing concentrations of<br />
indicators. However the small samples sizes of the data for this study (i.e. data for only two or three<br />
years at monitored sites) reduces the power of this technique to resolve temporal patterns.<br />
Consequently, most discussion on temporal trends in water quality is based on changes in overall<br />
water quality assessment at a site over years (see Figure 5). This approach provides a robust method<br />
of detecting changes in water quality based upon their compliance with the guidelines, and as such is<br />
likely to represent real changes in water quality.<br />
Site<br />
Source <strong>Water</strong><br />
Type<br />
Stream Name Trend 2001 2000 1999<br />
CAB-1 CSC UC <strong>Caboolture</strong> Rv or <br />
CAB-3 CSC LC <strong>Caboolture</strong> Rv <br />
CAB-6 CSC ME <strong>Caboolture</strong> Rv or <br />
CAB-7 CSC ME <strong>Caboolture</strong> Rv <br />
Improvement<br />
No trend<br />
Deterioration<br />
Variable trend<br />
Figure 5. Example of trend analysis of water quality assessment. The change in water quality assessments (coloured dots) over<br />
the years 1999 to 2001 were used to assess the direction of change (if any) of an indicator (green trend= improvement, red<br />
trend= deterioration, black trend= variable trend, blank= no trend). The direction of the arrow indicates whether concentrations<br />
of the indicators have increased or decreased.<br />
4.3 Data used in water quality analyses<br />
The data from the three programs were assessed for recent water quality condition, as well as water<br />
quality condition over previous years. Usually 12 months of monthly data is required for an accurate<br />
assessment of water quality. Some of the water quality programs did not comprise regular monthly<br />
sampling. As such, the data used in the analyses presented in this report were treated as follows:<br />
CSC- Bribie Island sites (3-monthly sampling)<br />
CSC-all other sites<br />
EPA – all sites<br />
PRCMP– all sites<br />
Data collected<br />
3/2000 – 9/2001 2001<br />
1/1999 – 11/1999 1999<br />
10/2000 – 9/2001 2001<br />
10/1999 – 9/2000 2000<br />
1/1999 – 9/1999 1999<br />
10/2000 – 9/2001 2001<br />
10/1999 – 9/2000 2000<br />
10/1998 – 9/1999 1999<br />
10/1999 – 4/2000, 12/2000 – 4/2000 2000<br />
10/1998 – 9/1999 1999<br />
10/1997 – 9/1998 1998<br />
Data<br />
reported as<br />
14

![Kumbartcho Brochure [PDF 540KB] - Moreton Bay Regional Council](https://img.yumpu.com/47220970/1/190x101/kumbartcho-brochure-pdf-540kb-moreton-bay-regional-council.jpg?quality=85)