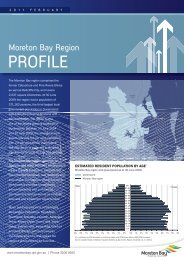
Caboolture Region Water Quality Study - Moreton Bay Regional ...
Caboolture Region Water Quality Study - Moreton Bay Regional ...
Caboolture Region Water Quality Study - Moreton Bay Regional ...

Create successful ePaper yourself
Turn your PDF publications into a flip-book with our unique Google optimized e-Paper software.
<strong>Caboolture</strong> <strong>Water</strong> <strong>Quality</strong> <strong>Study</strong><br />
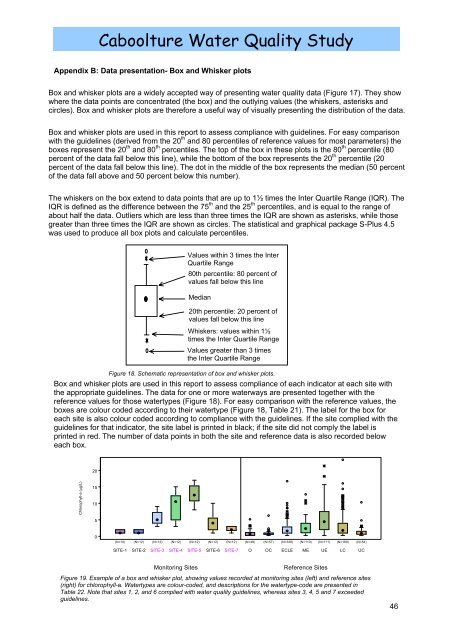
Appendix B: Data presentation- Box and Whisker plots<br />
Box and whisker plots are a widely accepted way of presenting water quality data (Figure 17). They show<br />
where the data points are concentrated (the box) and the outlying values (the whiskers, asterisks and<br />
circles). Box and whisker plots are therefore a useful way of visually presenting the distribution of the data.<br />
Box and whisker plots are used in this report to assess compliance with guidelines. For easy comparison<br />
with the guidelines (derived from the 20 th and 80 percentiles of reference values for most parameters) the<br />
boxes represent the 20 th and 80 th percentiles. The top of the box in these plots is the 80 th percentile (80<br />
percent of the data fall below this line), while the bottom of the box represents the 20 th percentile (20<br />
percent of the data fall below this line). The dot in the middle of the box represents the median (50 percent<br />
of the data fall above and 50 percent below this number).<br />
The whiskers on the box extend to data points that are up to 1½ times the Inter Quartile Range (IQR). The<br />
IQR is defined as the difference between the 75 th and the 25 th percentiles, and is equal to the range of<br />
about half the data. Outliers which are less than three times the IQR are shown as asterisks, while those<br />
greater than three times the IQR are shown as circles. The statistical and graphical package S-Plus 4.5<br />
was used to produce all box plots and calculate percentiles.<br />
Values within 3 times the Inter<br />
Quartile Range<br />
80th percentile: 80 percent of<br />
values fall below this line<br />
Median<br />
20th percentile: 20 percent of<br />
values fall below this line<br />
Whiskers: values within 1½<br />
times the Inter Quartile Range<br />
Values greater than 3 times<br />
the Inter Quartile Range<br />
Figure 18. Schematic representation of box and whisker plots.<br />
Box and whisker plots are used in this report to assess compliance of each indicator at each site with<br />
the appropriate guidelines. The data for one or more waterways are presented together with the<br />
reference values for those watertypes (Figure 18). For easy comparison with the reference values, the<br />
boxes are colour coded according to their watertype (Figure 18, Table 21). The label for the box for<br />
each site is also colour coded according to compliance with the guidelines. If the site complied with the<br />
guidelines for that indicator, the site label is printed in black; if the site did not comply the label is<br />
printed in red. The number of data points in both the site and reference data is also recorded below<br />
each box.<br />
Figure 1k Chlorophyll-a (g/L) at sites in an example waterway<br />
20<br />
Chlorophyll-a (g/L)<br />
15<br />
10<br />
5<br />
0<br />
(N=10) (N=12) (N=12) (N=12) (N=12) (N=12) (N=12) (N=49) (N=57) (N=336) (N=110) (N=111) (N=169) (N=54)<br />
SITE-1 SITE-2 SITE-3 SITE-4 SITE-5 SITE-6 SITE-7 O OC ECLE ME UE LC UC<br />
Monitoring Sites<br />
Reference Sites<br />
Figure 19. Example of a box and whisker plot, showing values recorded at monitoring sites (left) and reference sites<br />
(right) for chlorophyll-a. <strong>Water</strong>types are colour-coded, and descriptions for the watertype-code are presented in<br />
Table 22. Note that sites 1, 2, and 6 complied with water quality guidelines, whereas sites 3, 4, 5 and 7 exceeded<br />
guidelines.<br />
46

![Kumbartcho Brochure [PDF 540KB] - Moreton Bay Regional Council](https://img.yumpu.com/47220970/1/190x101/kumbartcho-brochure-pdf-540kb-moreton-bay-regional-council.jpg?quality=85)