Caboolture Region Water Quality Study - Moreton Bay Regional ...
Caboolture Region Water Quality Study - Moreton Bay Regional ...
Caboolture Region Water Quality Study - Moreton Bay Regional ...

Create successful ePaper yourself
Turn your PDF publications into a flip-book with our unique Google optimized e-Paper software.
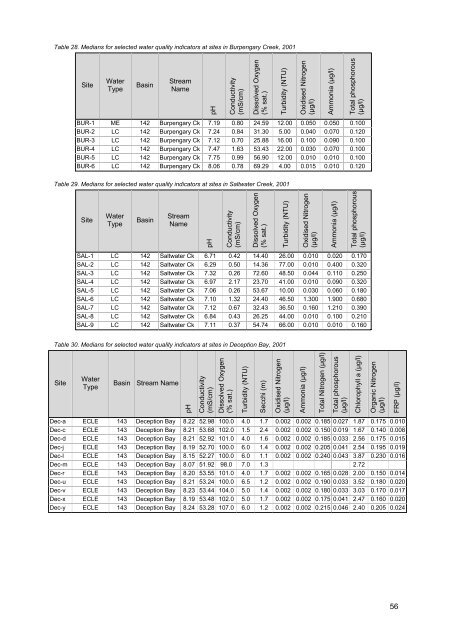
Table 28. Medians for selected water quality indicators at sites in Burpengary Creek, 2001<br />
Site<br />
<strong>Water</strong><br />
Type<br />
Basin<br />
Stream<br />
Name<br />
pH<br />
Conductivity<br />
(mS/cm)<br />
Dissolved Oxygen<br />
(% sat.)<br />
Turbidity (NTU)<br />
Oxidised Nitrogen<br />
(μg/l)<br />
Ammonia (μg/l)<br />
Total phosphorous<br />
(μg/l)<br />
BUR-1 ME 142 Burpengary Ck 7.19 0.80 24.59 12.00 0.050 0.050 0.100<br />
BUR-2 LC 142 Burpengary Ck 7.24 0.84 31.30 5.00 0.040 0.070 0.120<br />
BUR-3 LC 142 Burpengary Ck 7.12 0.70 25.88 16.00 0.100 0.090 0.100<br />
BUR-4 LC 142 Burpengary Ck 7.47 1.63 53.43 22.00 0.030 0.070 0.100<br />
BUR-5 LC 142 Burpengary Ck 7.75 0.99 56.90 12.00 0.010 0.010 0.100<br />
BUR-6 LC 142 Burpengary Ck 8.06 0.78 69.29 4.00 0.015 0.010 0.120<br />
Table 29. Medians for selected water quality indicators at sites in Saltwater Creek, 2001<br />
Site<br />
<strong>Water</strong><br />
Type<br />
Basin<br />
Stream<br />
Name<br />
pH<br />
Conductivity<br />
(mS/cm)<br />
Dissolved Oxygen<br />
(% sat.)<br />
Turbidity (NTU)<br />
Oxidised Nitrogen<br />
(μg/l)<br />
Ammonia (μg/l)<br />
Total phosphorous<br />
(μg/l)<br />
SAL-1 LC 142 Saltwater Ck 6.71 0.42 14.40 26.00 0.010 0.020 0.170<br />
SAL-2 LC 142 Saltwater Ck 6.29 0.50 14.36 77.00 0.010 0.400 0.320<br />
SAL-3 LC 142 Saltwater Ck 7.32 0.26 72.60 48.50 0.044 0.110 0.250<br />
SAL-4 LC 142 Saltwater Ck 6.97 2.17 23.70 41.00 0.010 0.090 0.320<br />
SAL-5 LC 142 Saltwater Ck 7.06 0.26 53.67 10.00 0.030 0.060 0.180<br />
SAL-6 LC 142 Saltwater Ck 7.10 1.32 24.40 46.50 1.300 1.900 0.680<br />
SAL-7 LC 142 Saltwater Ck 7.12 0.67 32.43 36.50 0.160 1.210 0.390<br />
SAL-8 LC 142 Saltwater Ck 6.84 0.43 26.25 44.00 0.010 0.100 0.210<br />
SAL-9 LC 142 Saltwater Ck 7.11 0.37 54.74 66.00 0.010 0.010 0.160<br />
Table 30. Medians for selected water quality indicators at sites in Deception <strong>Bay</strong>, 2001<br />
Site<br />
<strong>Water</strong><br />
Type<br />
Basin<br />
Stream Name<br />
pH<br />
Conductivity<br />
(mS/cm)<br />
Dissolved Oxygen<br />
(% sat.)<br />
Turbidity (NTU)<br />
Secchi (m)<br />
Oxidised Nitrogen<br />
(μg/l)<br />
Ammonia (μg/l)<br />
Total Nitrogen (μg/l)<br />
Total phosphorous<br />
(μg/l)<br />
Chlorophyll a (μg/l)<br />
Organic Nitrogen<br />
(μg/l)<br />
FRP (μg/l)<br />
Dec-a ECLE 143 Deception <strong>Bay</strong> 8.22 52.98 100.0 4.0 1.7 0.002 0.002 0.185 0.027 1.87 0.175 0.010<br />
Dec-c ECLE 143 Deception <strong>Bay</strong> 8.21 53.68 102.0 1.5 2.4 0.002 0.002 0.150 0.019 1.67 0.140 0.008<br />
Dec-d ECLE 143 Deception <strong>Bay</strong> 8.21 52.92 101.0 4.0 1.6 0.002 0.002 0.185 0.033 2.56 0.175 0.015<br />
Dec-j ECLE 143 Deception <strong>Bay</strong> 8.19 52.70 100.0 6.0 1.4 0.002 0.002 0.205 0.041 2.54 0.195 0.019<br />
Dec-l ECLE 143 Deception <strong>Bay</strong> 8.15 52.27 100.0 6.0 1.1 0.002 0.002 0.240 0.043 3.87 0.230 0.016<br />
Dec-m ECLE 143 Deception <strong>Bay</strong> 8.07 51.92 98.0 7.0 1.3 2.72<br />
Dec-r ECLE 143 Deception <strong>Bay</strong> 8.20 53.55 101.0 4.0 1.7 0.002 0.002 0.165 0.028 2.00 0.150 0.014<br />
Dec-u ECLE 143 Deception <strong>Bay</strong> 8.21 53.24 100.0 6.5 1.2 0.002 0.002 0.190 0.033 3.52 0.180 0.020<br />
Dec-v ECLE 143 Deception <strong>Bay</strong> 8.23 53.44 104.0 5.0 1.4 0.002 0.002 0.180 0.033 3.03 0.170 0.017<br />
Dec-x ECLE 143 Deception <strong>Bay</strong> 8.19 53.48 102.0 5.0 1.7 0.002 0.002 0.175 0.041 2.47 0.160 0.020<br />
Dec-y ECLE 143 Deception <strong>Bay</strong> 8.24 53.28 107.0 6.0 1.2 0.002 0.002 0.215 0.046 2.40 0.205 0.024<br />
56

![Kumbartcho Brochure [PDF 540KB] - Moreton Bay Regional Council](https://img.yumpu.com/47220970/1/190x101/kumbartcho-brochure-pdf-540kb-moreton-bay-regional-council.jpg?quality=85)