Caboolture Region Water Quality Study - Moreton Bay Regional ...
Caboolture Region Water Quality Study - Moreton Bay Regional ...
Caboolture Region Water Quality Study - Moreton Bay Regional ...

Create successful ePaper yourself
Turn your PDF publications into a flip-book with our unique Google optimized e-Paper software.
Pumicestone Passage<br />
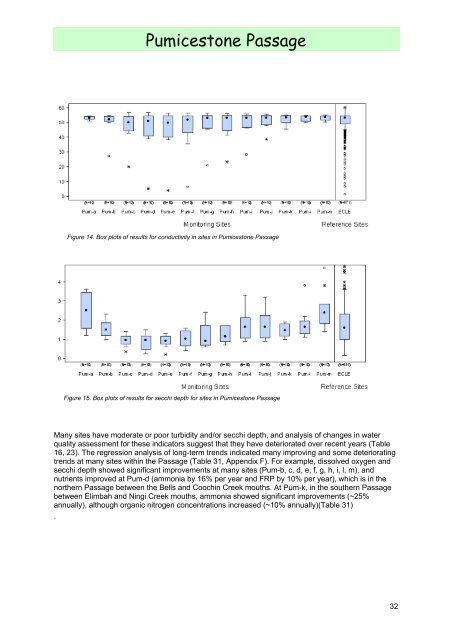
Figure 14. Box plots of results for conductivity in sites in Pumicestone Passage<br />
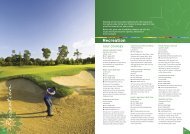
Figure 15. Box plots of results for secchi depth for sites in Pumicestone Passage<br />
Many sites have moderate or poor turbidity and/or secchi depth, and analysis of changes in water<br />
quality assessment for these indicators suggest that they have deteriorated over recent years (Table<br />
16, 23). The regression analysis of long-term trends indicated many improving and some deteriorating<br />
trends at many sites within the Passage (Table 31, Appendix F). For example, dissolved oxygen and<br />
secchi depth showed significant improvements at many sites (Pum-b, c, d, e, f, g, h, i, l, m), and<br />
nutrients improved at Pum-d (ammonia by 16% per year and FRP by 10% per year), which is in the<br />
northern Passage between the Bells and Coochin Creek mouths. At Pum-k, in the southern Passage<br />
between Elimbah and Ningi Creek mouths, ammonia showed significant improvements (~25%<br />
annually), although organic nitrogen concentrations increased (~10% annually)(Table 31)<br />
.<br />
32


![Kumbartcho Brochure [PDF 540KB] - Moreton Bay Regional Council](https://img.yumpu.com/47220970/1/190x101/kumbartcho-brochure-pdf-540kb-moreton-bay-regional-council.jpg?quality=85)