Caboolture Region Water Quality Study - Moreton Bay Regional ...
Caboolture Region Water Quality Study - Moreton Bay Regional ...
Caboolture Region Water Quality Study - Moreton Bay Regional ...

You also want an ePaper? Increase the reach of your titles
YUMPU automatically turns print PDFs into web optimized ePapers that Google loves.
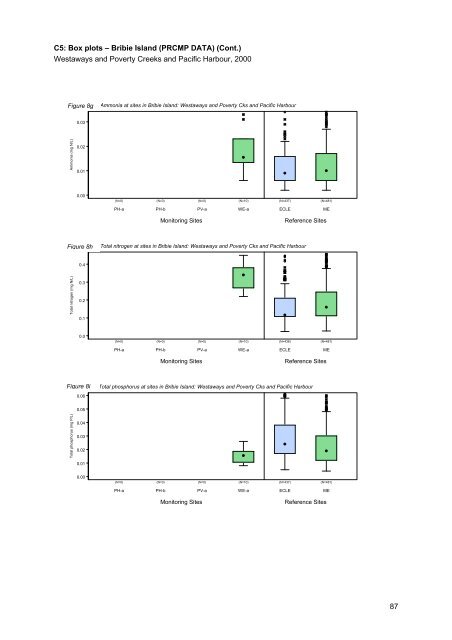
C5: Box plots – Bribie Island (PRCMP DATA) (Cont.)<br />
Westaways and Poverty Creeks and Pacific Harbour, 2000<br />
Figure 8g6g Ammonia at sites in Bribie Island: Westaways and Poverty Cks and Pacific Harbour<br />
0.03<br />
Ammonia (mg N/L)<br />
0.02<br />
0.01<br />
0.00<br />
(N=0) (N=0) (N=0) (N=10) (N=437) (N=481)<br />
PH-a PH-b PV-a WE-a ECLE ME<br />
Monitoring Sites<br />
Reference Sites<br />
Figure 8h 6h Total nitrogen at sites in Bribie Island: Westaways and Poverty Cks and Pacific Harbour<br />
0.4<br />
Total nitrogen (mg N/L)<br />
0.3<br />
0.2<br />
0.1<br />
0.0<br />
(N=0) (N=0) (N=0) (N=10) (N=436) (N=481)<br />
PH-a PH-b PV-a WE-a ECLE ME<br />
Monitoring Sites<br />
Reference Sites<br />
Figure 8i 6i Total phosphorus at sites in Bribie Island: Westaways and Poverty Cks and Pacific Harbour<br />
0.06<br />
0.05<br />
Total phosphorus (mg P/L)<br />
0.04<br />
0.03<br />
0.02<br />
0.01<br />
0.00<br />
(N=0) (N=0) (N=0) (N=10) (N=437) (N=481)<br />
PH-a PH-b PV-a WE-a ECLE ME<br />
Monitoring Sites<br />
Reference Sites<br />
87

![Kumbartcho Brochure [PDF 540KB] - Moreton Bay Regional Council](https://img.yumpu.com/47220970/1/190x101/kumbartcho-brochure-pdf-540kb-moreton-bay-regional-council.jpg?quality=85)