Caboolture Region Water Quality Study - Moreton Bay Regional ...
Caboolture Region Water Quality Study - Moreton Bay Regional ...
Caboolture Region Water Quality Study - Moreton Bay Regional ...

You also want an ePaper? Increase the reach of your titles
YUMPU automatically turns print PDFs into web optimized ePapers that Google loves.
<strong>Caboolture</strong> River Catchment<br />
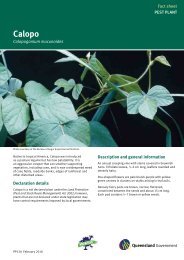
Figure 7. Box plots of results for dissolved oxygen for sites in the <strong>Caboolture</strong> River. Refer to Appendix B,<br />
p. 54, for details on the interpretation of box plots.<br />
STP<br />
STP<br />
Weir<br />
Figure 8. Box plots of results for total nitrogen for sites in the <strong>Caboolture</strong> River. Refer to Appendix B, p.<br />
54, for details on the interpretation of box plots.<br />
Nutrient concentrations have increased over recent years at most estuarine sites (Table 5). An<br />
analysis of changes in water quality assessments suggested that at most sites between 4.8 km and<br />
17.1 km upstream, nitrogen (in all species) has increased (Table 5, Table 23). Some sites that had<br />
good water quality condition ratings for ammonia and total phosphorus in 2000 had poor condition<br />
ratings in 2001; this increase may represent a real increase in nutrient input to <strong>Caboolture</strong> River, or<br />
may be related to changes in laboratory techniques. The regression analysis of long-term trends<br />
indicated improving trends of secchi depth at many sites (Cab-1.6, Cab-7.6, Cab-15.1, Cab-18.8) and<br />
nutrients at sites near the river mouth since 1994. (For example, at site Cab-1.6 total phosphorus<br />
improved by 4% and ammonia by 21% annually; see Table 28 in Appendix F for full results).<br />
Regression analysis also indicated that pH has decreased at some of the estuarine sites since 1994,<br />
although the amount of change was small (Table 31, Appendix D).<br />
A comparison of water quality condition with previous years shows that most freshwater sites (CAB-<br />
1,2,3,4) have shown improvements in nutrients and that dissolved oxygen and turbidity have also<br />
improved at some sites (Table 5).<br />
The pattern of poor water quality at estuarine sites and better quality water at freshwater sites was<br />
also evident in a number of other physical indicators, including the size and integrity of riparian<br />
vegetation, reach environs, bank stability and channel diversity (Appendix, G, ANA, 1998; SoR, 2001).<br />
Similarly, some upstream sites in the <strong>Caboolture</strong> River have fish communities classed as being in<br />
18


![Kumbartcho Brochure [PDF 540KB] - Moreton Bay Regional Council](https://img.yumpu.com/47220970/1/190x101/kumbartcho-brochure-pdf-540kb-moreton-bay-regional-council.jpg?quality=85)