Caboolture Region Water Quality Study - Moreton Bay Regional ...
Caboolture Region Water Quality Study - Moreton Bay Regional ...
Caboolture Region Water Quality Study - Moreton Bay Regional ...

You also want an ePaper? Increase the reach of your titles
YUMPU automatically turns print PDFs into web optimized ePapers that Google loves.
Pumicestone Passage<br />
5.6 Pumicestone Passage<br />
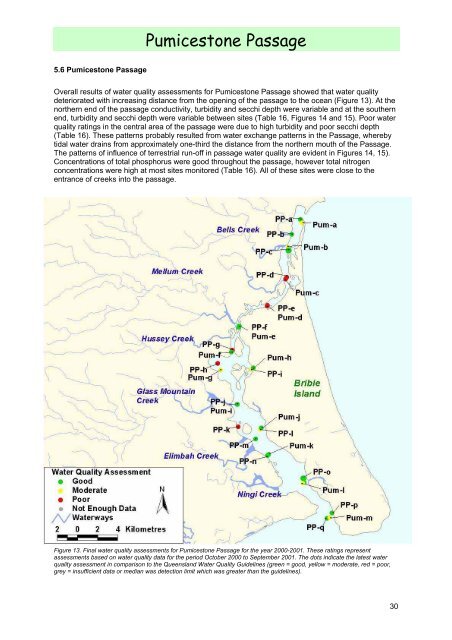
Overall results of water quality assessments for Pumicestone Passage showed that water quality<br />
deteriorated with increasing distance from the opening of the passage to the ocean (Figure 13). At the<br />
northern end of the passage conductivity, turbidity and secchi depth were variable and at the southern<br />
end, turbidity and secchi depth were variable between sites (Table 16, Figures 14 and 15). Poor water<br />
quality ratings in the central area of the passage were due to high turbidity and poor secchi depth<br />
(Table 16). These patterns probably resulted from water exchange patterns in the Passage, whereby<br />
tidal water drains from approximately one-third the distance from the northern mouth of the Passage.<br />
The patterns of influence of terrestrial run-off in passage water quality are evident in Figures 14, 15).<br />
Concentrations of total phosphorus were good throughout the passage, however total nitrogen<br />
concentrations were high at most sites monitored (Table 16). All of these sites were close to the<br />
entrance of creeks into the passage.<br />
Figure 13. Final water quality assessments for Pumicestone Passage for the year 2000-2001. These ratings represent<br />
assessments based on water quality data for the period October 2000 to September 2001. The dots indicate the latest water<br />
quality assessment in comparison to the Queensland <strong>Water</strong> <strong>Quality</strong> Guidelines (green = good, yellow = moderate, red = poor,<br />
grey = insufficient data or median was detection limit which was greater than the guidelines).<br />
30

![Kumbartcho Brochure [PDF 540KB] - Moreton Bay Regional Council](https://img.yumpu.com/47220970/1/190x101/kumbartcho-brochure-pdf-540kb-moreton-bay-regional-council.jpg?quality=85)