Caboolture Region Water Quality Study - Moreton Bay Regional ...
Caboolture Region Water Quality Study - Moreton Bay Regional ...
Caboolture Region Water Quality Study - Moreton Bay Regional ...

Create successful ePaper yourself
Turn your PDF publications into a flip-book with our unique Google optimized e-Paper software.
<strong>Caboolture</strong> <strong>Water</strong> <strong>Quality</strong> <strong>Study</strong><br />
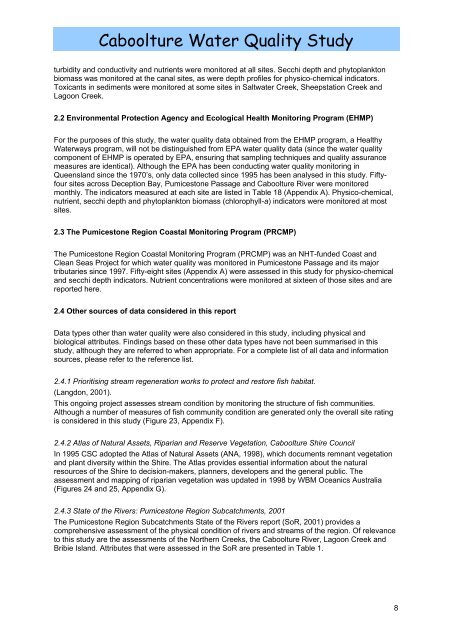
turbidity and conductivity and nutrients were monitored at all sites. Secchi depth and phytoplankton<br />
biomass was monitored at the canal sites, as were depth profiles for physico-chemical indicators.<br />
Toxicants in sediments were monitored at some sites in Saltwater Creek, Sheepstation Creek and<br />
Lagoon Creek.<br />
2.2 Environmental Protection Agency and Ecological Health Monitoring Program (EHMP)<br />
For the purposes of this study, the water quality data obtained from the EHMP program, a Healthy<br />
<strong>Water</strong>ways program, will not be distinguished from EPA water quality data (since the water quality<br />
component of EHMP is operated by EPA, ensuring that sampling techniques and quality assurance<br />
measures are identical). Although the EPA has been conducting water quality monitoring in<br />
Queensland since the 1970’s, only data collected since 1995 has been analysed in this study. Fiftyfour<br />
sites across Deception <strong>Bay</strong>, Pumicestone Passage and <strong>Caboolture</strong> River were monitored<br />
monthly. The indicators measured at each site are listed in Table 18 (Appendix A). Physico-chemical,<br />
nutrient, secchi depth and phytoplankton biomass (chlorophyll-a) indicators were monitored at most<br />
sites.<br />
2.3 The Pumicestone <strong>Region</strong> Coastal Monitoring Program (PRCMP)<br />
The Pumicestone <strong>Region</strong> Coastal Monitoring Program (PRCMP) was an NHT-funded Coast and<br />
Clean Seas Project for which water quality was monitored in Pumicestone Passage and its major<br />
tributaries since 1997. Fifty-eight sites (Appendix A) were assessed in this study for physico-chemical<br />
and secchi depth indicators. Nutrient concentrations were monitored at sixteen of those sites and are<br />
reported here.<br />
2.4 Other sources of data considered in this report<br />
Data types other than water quality were also considered in this study, including physical and<br />
biological attributes. Findings based on these other data types have not been summarised in this<br />
study, although they are referred to when appropriate. For a complete list of all data and information<br />
sources, please refer to the reference list.<br />
2.4.1 Prioritising stream regeneration works to protect and restore fish habitat.<br />
(Langdon, 2001).<br />
This ongoing project assesses stream condition by monitoring the structure of fish communities.<br />
Although a number of measures of fish community condition are generated only the overall site rating<br />
is considered in this study (Figure 23, Appendix F).<br />
2.4.2 Atlas of Natural Assets, Riparian and Reserve Vegetation, <strong>Caboolture</strong> Shire Council<br />
In 1995 CSC adopted the Atlas of Natural Assets (ANA, 1998), which documents remnant vegetation<br />
and plant diversity within the Shire. The Atlas provides essential information about the natural<br />
resources of the Shire to decision-makers, planners, developers and the general public. The<br />
assessment and mapping of riparian vegetation was updated in 1998 by WBM Oceanics Australia<br />
(Figures 24 and 25, Appendix G).<br />
2.4.3 State of the Rivers: Pumicestone <strong>Region</strong> Subcatchments, 2001<br />
The Pumicestone <strong>Region</strong> Subcatchments State of the Rivers report (SoR, 2001) provides a<br />
comprehensive assessment of the physical condition of rivers and streams of the region. Of relevance<br />
to this study are the assessments of the Northern Creeks, the <strong>Caboolture</strong> River, Lagoon Creek and<br />
Bribie Island. Attributes that were assessed in the SoR are presented in Table 1.<br />
8


![Kumbartcho Brochure [PDF 540KB] - Moreton Bay Regional Council](https://img.yumpu.com/47220970/1/190x101/kumbartcho-brochure-pdf-540kb-moreton-bay-regional-council.jpg?quality=85)