Caboolture Region Water Quality Study - Moreton Bay Regional ...
Caboolture Region Water Quality Study - Moreton Bay Regional ...
Caboolture Region Water Quality Study - Moreton Bay Regional ...

Create successful ePaper yourself
Turn your PDF publications into a flip-book with our unique Google optimized e-Paper software.
<strong>Caboolture</strong> <strong>Water</strong> <strong>Quality</strong> <strong>Study</strong><br />
In this study, National guidelines (ANZECC & ARMCANZ, 2000) were used to define low, moderate<br />
and high concentrations of faecal coliforms, corresponding respectively to good, moderate and poor<br />
water quality. The guidelines recommend median faecal coliform concentrations lower than 150 CFU<br />
per 100mL for primary contact activities (e.g. swimming) and median concentrations lower than 1000<br />
CFU per 100mL for secondary contact activities (e.g. canoeing). Therefore, concentrations of less<br />
than 150 CFU per 100mL are defined as “low” concentrations, and concentrations between 150 and<br />
1000 CFU per 100mL are defined as “moderate”. Concentrations greater than 1000 CFU per 100mL<br />
are regarded as “high”.<br />
4.0 ASSESSMENT OF WATER QUALITY DATA<br />
4.1 Assessment of Current <strong>Water</strong> <strong>Quality</strong> Data<br />
A three-stage process was employed in the assessment of water quality at monitored (test) sites<br />
throughout the <strong>Caboolture</strong> <strong>Region</strong> for water quality data (sediment toxicants and faecal coliforms were<br />
considered separately and not included in the integrated assessment). The three steps of the<br />
processes are:<br />
1. assessment of test site data for individual indicators against guideline values;<br />
2. assessment of indicator categories (comprised of multiple indicators); and<br />
3. an (overall) integrated assessment based on individual indicators and indicator categories.<br />
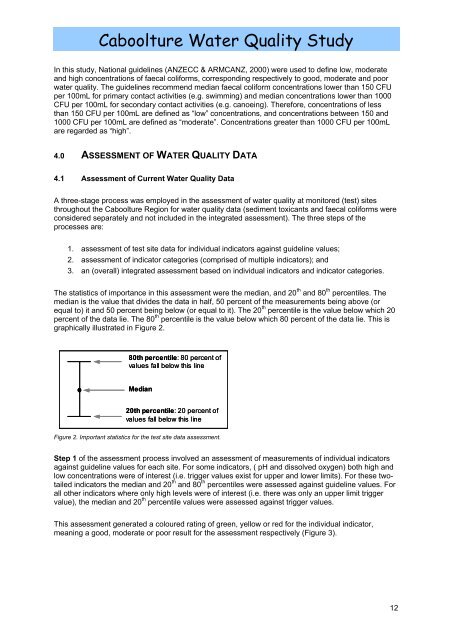
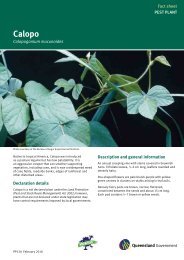
The statistics of importance in this assessment were the median, and 20 th and 80 th percentiles. The<br />
median is the value that divides the data in half, 50 percent of the measurements being above (or<br />
equal to) it and 50 percent being below (or equal to it). The 20 th percentile is the value below which 20<br />
percent of the data lie. The 80 th percentile is the value below which 80 percent of the data lie. This is<br />
graphically illustrated in Figure 2.<br />
80th percentile: 80 percent of<br />
values fall below this line<br />
Median<br />
20th percentile: 20 percent of<br />
values fall below this line<br />
Figure 2. Important statistics for the test site data assessment.<br />
Step 1 of the assessment process involved an assessment of measurements of individual indicators<br />
against guideline values for each site. For some indicators, ( pH and dissolved oxygen) both high and<br />
low concentrations were of interest (i.e. trigger values exist for upper and lower limits). For these twotailed<br />
indicators the median and 20 th and 80 th percentiles were assessed against guideline values. For<br />
all other indicators where only high levels were of interest (i.e. there was only an upper limit trigger<br />
value), the median and 20 th percentile values were assessed against trigger values.<br />
This assessment generated a coloured rating of green, yellow or red for the individual indicator,<br />
meaning a good, moderate or poor result for the assessment respectively (Figure 3).<br />
12


![Kumbartcho Brochure [PDF 540KB] - Moreton Bay Regional Council](https://img.yumpu.com/47220970/1/190x101/kumbartcho-brochure-pdf-540kb-moreton-bay-regional-council.jpg?quality=85)