A Day in the Life of Adult Protective Services - Final Report ... - CWDA
A Day in the Life of Adult Protective Services - Final Report ... - CWDA
A Day in the Life of Adult Protective Services - Final Report ... - CWDA

You also want an ePaper? Increase the reach of your titles
YUMPU automatically turns print PDFs into web optimized ePapers that Google loves.
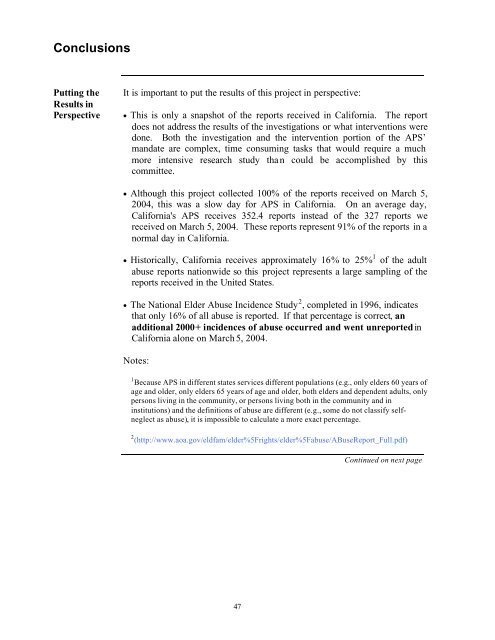
Conclusions<br />
Putt<strong>in</strong>g <strong>the</strong><br />
Results <strong>in</strong><br />
Perspective<br />
It is important to put <strong>the</strong> results <strong>of</strong> this project <strong>in</strong> perspective:<br />
• This is only a snapshot <strong>of</strong> <strong>the</strong> reports received <strong>in</strong> California. The report<br />
does not address <strong>the</strong> results <strong>of</strong> <strong>the</strong> <strong>in</strong>vestigations or what <strong>in</strong>terventions were<br />
done. Both <strong>the</strong> <strong>in</strong>vestigation and <strong>the</strong> <strong>in</strong>tervention portion <strong>of</strong> <strong>the</strong> APS’<br />
mandate are complex, time consum<strong>in</strong>g tasks that would require a much<br />
more <strong>in</strong>tensive research study than could be accomplished by this<br />
committee.<br />
• Although this project collected 100% <strong>of</strong> <strong>the</strong> reports received on March 5,<br />
2004, this was a slow day for APS <strong>in</strong> California. On an average day,<br />
California's APS receives 352.4 reports <strong>in</strong>stead <strong>of</strong> <strong>the</strong> 327 reports we<br />
received on March 5, 2004. These reports represent 91% <strong>of</strong> <strong>the</strong> reports <strong>in</strong> a<br />
normal day <strong>in</strong> California.<br />
• Historically, California receives approximately 16% to 25% 1 <strong>of</strong> <strong>the</strong> adult<br />
abuse reports nationwide so this project represents a large sampl<strong>in</strong>g <strong>of</strong> <strong>the</strong><br />
reports received <strong>in</strong> <strong>the</strong> United States.<br />
• The National Elder Abuse Incidence Study 2 , completed <strong>in</strong> 1996, <strong>in</strong>dicates<br />
that only 16% <strong>of</strong> all abuse is reported. If that percentage is correct, an<br />
additional 2000+ <strong>in</strong>cidences <strong>of</strong> abuse occurred and went unreported <strong>in</strong><br />
California alone on March 5, 2004.<br />
Notes:<br />
1 Because APS <strong>in</strong> different states services different populations (e.g., only elders 60 years <strong>of</strong><br />
age and older, only elders 65 years <strong>of</strong> age and older, both elders and dependent adults, only<br />
persons liv<strong>in</strong>g <strong>in</strong> <strong>the</strong> community, or persons liv<strong>in</strong>g both <strong>in</strong> <strong>the</strong> community and <strong>in</strong><br />
<strong>in</strong>stitutions) and <strong>the</strong> def<strong>in</strong>itions <strong>of</strong> abuse are different (e.g., some do not classify selfneglect<br />
as abuse), it is impossible to calculate a more exact percentage.<br />
2 (http://www.aoa.gov/eldfam/elder%5Frights/elder%5Fabuse/ABuse<strong>Report</strong>_Full.pdf)<br />
Cont<strong>in</strong>ued on next page<br />
47