

to download the PDF for MFMA Mangaung In ... - Mangaung.co.za
to download the PDF for MFMA Mangaung In ... - Mangaung.co.za
to download the PDF for MFMA Mangaung In ... - Mangaung.co.za

You also want an ePaper? Increase the reach of your titles
YUMPU automatically turns print PDFs into web optimized ePapers that Google loves.
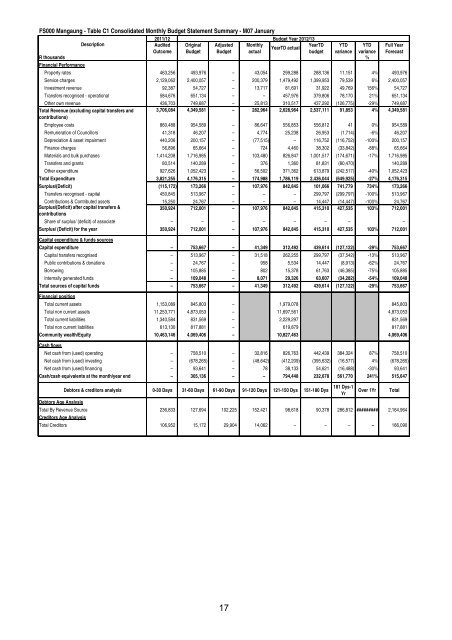
FS000 <strong>Mangaung</strong> - Table C1 Consolidated Monthly Budget Statement Summary - M07 January<br />
2011/12<br />
Budget Year 2012/13<br />
Description<br />
Audited Original Adjusted Monthly<br />
YearTD YTD YTD Full Year<br />
YearTD actual<br />
Out<strong>co</strong>me Budget Budget actual<br />
budget variance variance Forecast<br />
R thousands %<br />
Financial Per<strong>for</strong>mance<br />
Property rates 463,256 493,976 – 43,054 299,288 288,136 11,151 4% 493,976<br />
Service charges 2,129,062 2,400,057 – 200,379 1,479,492 1,399,953 79,539 6% 2,400,057<br />
<strong>In</strong>vestment revenue 92,387 54,727 – 13,717 81,691 31,922 49,769 156% 54,727<br />
Transfers re<strong>co</strong>gnised - operational 584,676 651,134 – – 457,976 379,806 78,170 21% 651,134<br />
O<strong>the</strong>r own revenue 436,703 749,687 – 25,813 310,517 437,292 (126,775) -29% 749,687<br />
Total Revenue (excluding capital transfers and 3,706,084 4,349,581 – 282,964 2,628,964 2,537,111 91,853 4% 4,349,581<br />
<strong>co</strong>ntributions)<br />
Employee <strong>co</strong>sts 860,488 954,589 – 86,647 556,853 556,812 41 0% 954,589<br />
Remuneration of Councillors 41,318 46,207 – 4,774 25,238 26,953 (1,714) -6% 46,207<br />
Depreciation & asset impairment 440,206 200,157 – (77,515) – 116,752 (116,752) -100% 200,157<br />
Finance charges 56,896 65,664 – 724 4,460 38,302 (33,842) -88% 65,664<br />
Materials and bulk purchases 1,414,208 1,716,985 – 103,480 826,847 1,001,517 (174,671) -17% 1,716,985<br />
Transfers and grants 80,514 140,289 – 376 1,360 81,831 (80,470) 140,289<br />
O<strong>the</strong>r expenditure 927,626 1,052,423 – 56,502 371,362 613,879 (242,517) -40% 1,052,423<br />
Total Expenditure 3,821,255 4,176,315 – 174,988 1,786,119 2,436,044 (649,925) -27% 4,176,315<br />
Surplus/(Deficit) (115,172) 173,266 – 107,976 842,845 101,066 741,779 734% 173,266<br />
Transfers re<strong>co</strong>gnised - capital 450,845 513,967 – – – 299,797 (299,797) -100% 513,967<br />
Contributions & Contributed assets 15,250 24,767 – – – 14,447 (14,447) -100% 24,767<br />
Surplus/(Deficit) after capital transfers &<br />
350,924 712,001 – 107,976 842,845 415,310 427,535 103% 712,001<br />
<strong>co</strong>ntributions<br />
Share of surplus/ (deficit) of associate – – – – – – – –<br />
Surplus/ (Deficit) <strong>for</strong> <strong>the</strong> year 350,924 712,001 – 107,976 842,845 415,310 427,535 103% 712,001<br />
Capital expenditure & funds sources<br />
Capital expenditure – 753,667 – 41,349 312,492 439,614 (127,122) -29% 753,667<br />
Capital transfers re<strong>co</strong>gnised – 513,967 – 31,518 262,255 299,797 (37,542) -13% 513,967<br />
Public <strong>co</strong>ntributions & donations – 24,767 – 958 5,534 14,447 (8,913) -62% 24,767<br />
Borrowing – 105,885 – 802 15,378 61,763 (46,385) -75% 105,885<br />
<strong>In</strong>ternally generated funds – 109,048 – 8,071 29,326 63,607 (34,282) -54% 109,048<br />
Total sources of capital funds – 753,667 – 41,349 312,492 439,614 (127,122) -29% 753,667<br />
Financial position<br />
Total current assets 1,153,089 845,803 – 1,979,078 845,803<br />
Total non current assets 11,253,771 4,873,053 – 11,697,561 4,873,053<br />
Total current liabilities 1,340,584 831,569 – 2,229,297 831,569<br />
Total non current liabilities 613,130 817,881 – 619,879 817,881<br />
Community wealth/Equity 10,463,146 4,069,406 – 10,827,463 4,069,406<br />
Cash flows<br />
Net cash from (used) operating – 758,510 – 32,816 826,763 442,439 384,324 87% 758,510<br />
Net cash from (used) investing – (678,265) – (48,642) (412,209) (395,632) (16,577) 4% (678,265)<br />
Net cash from (used) financing – 93,641 – 78 38,133 54,621 (16,488) -30% 93,641<br />
Cash/cash equivalents at <strong>the</strong> month/year end – 305,136 – – 794,448 232,678 561,770 241% 515,647<br />
Deb<strong>to</strong>rs & credi<strong>to</strong>rs analysis 0-30 Days 31-60 Days 61-90 Days 91-120 Days 121-150 Dys 151-180 Dys<br />
181 Dys-1<br />
Yr<br />
Over 1Yr Total<br />
Deb<strong>to</strong>rs Age Analysis<br />
Total By Revenue Source 236,833 127,694 102,225 152,421 98,618 90,378 286,812 ######### 2,164,964<br />
Credi<strong>to</strong>rs Age Analysis<br />
Total Credi<strong>to</strong>rs 106,952 15,172 29,904 14,062 – – – – 166,090<br />
17


