

to download the PDF for MFMA Mangaung In ... - Mangaung.co.za
to download the PDF for MFMA Mangaung In ... - Mangaung.co.za
to download the PDF for MFMA Mangaung In ... - Mangaung.co.za

You also want an ePaper? Increase the reach of your titles
YUMPU automatically turns print PDFs into web optimized ePapers that Google loves.
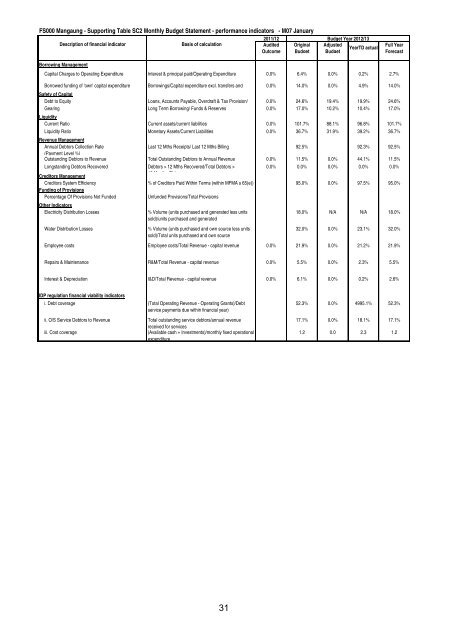
FS000 <strong>Mangaung</strong> - Supporting Table SC2 Monthly Budget Statement - per<strong>for</strong>mance indica<strong>to</strong>rs - M07 January<br />
2011/12 Budget Year 2012/13<br />
Description of financial indica<strong>to</strong>r<br />
Basis of calculation<br />
Audited Original Adjusted<br />
YearTD actual<br />
Out<strong>co</strong>me Budget Budget<br />
Full Year<br />
Forecast<br />
Borrowing Management<br />
Capital Charges <strong>to</strong> Operating Expenditure <strong>In</strong>terest & principal paid/Operating Expenditure 0.0% 6.4% 0.0% 0.2% 2.7%<br />
Borrowed funding of 'own' capital expenditure Borrowings/Capital expenditure excl. transfers and 0.0% 14.0% 0.0% 4.9% 14.0%<br />
Safety of Capital<br />
Debt <strong>to</strong> Equity Loans, Ac<strong>co</strong>unts Payable, Overdraft & Tax Provision/ 0.0% 24.6% 19.4% 19.9% 24.6%<br />
Gearing Long Term Borrowing/ Funds & Reserves 0.0% 17.0% 10.2% 10.4% 17.0%<br />
Liquidity<br />
Current Ratio Current assets/current liabilities 0.0% 101.7% 88.1% 96.8% 101.7%<br />
Liquidity Ratio Monetary Assets/Current Liabilities 0.0% 36.7% 31.9% 39.2% 36.7%<br />
Revenue Management<br />
Annual Deb<strong>to</strong>rs Collection Rate<br />
Last 12 Mths Receipts/ Last 12 Mths Billing 92.5% 92.3% 92.5%<br />
(Payment Level %)<br />
Outstanding Deb<strong>to</strong>rs <strong>to</strong> Revenue Total Outstanding Deb<strong>to</strong>rs <strong>to</strong> Annual Revenue 0.0% 11.5% 0.0% 44.1% 11.5%<br />
Longstanding Deb<strong>to</strong>rs Re<strong>co</strong>vered Deb<strong>to</strong>rs > 12 Mths Re<strong>co</strong>vered/Total Deb<strong>to</strong>rs ><br />
0.0% 0.0% 0.0% 0.0% 0.0%<br />
Credi<strong>to</strong>rs Management<br />
12 M th Old<br />
Credi<strong>to</strong>rs System Efficiency % of Credi<strong>to</strong>rs Paid Within Terms (within <strong>MFMA</strong> s 65(e)) 95.0% 0.0% 97.5% 95.0%<br />
Funding of Provisions<br />
Percentage Of Provisions Not Funded<br />
Unfunded Provisions/Total Provisions<br />
O<strong>the</strong>r <strong>In</strong>dica<strong>to</strong>rs<br />
Electricity Distribution Losses<br />
Water Distribution Losses<br />
% Volume (units purchased and generated less units<br />
sold)/units purchased and generated<br />
% Volume (units purchased and own source less units<br />
sold)/Total units purchased and own source<br />
18.0% N/A N/A 18.0%<br />
32.0% 0.0% 23.1% 32.0%<br />
Employee <strong>co</strong>sts Employee <strong>co</strong>sts/Total Revenue - capital revenue 0.0% 21.9% 0.0% 21.2% 21.9%<br />
Repairs & Maintenance R&M/Total Revenue - capital revenue 0.0% 5.5% 0.0% 2.3% 5.5%<br />
<strong>In</strong>terest & Depreciation I&D/Total Revenue - capital revenue 0.0% 6.1% 0.0% 0.2% 2.6%<br />
IDP regulation financial viability indica<strong>to</strong>rs<br />
i. Debt <strong>co</strong>verage (Total Operating Revenue - Operating Grants)/Debt<br />
service payments due within financial year)<br />
ii. O/S Service Deb<strong>to</strong>rs <strong>to</strong> Revenue<br />
iii. Cost <strong>co</strong>verage<br />
Total outstanding service deb<strong>to</strong>rs/annual revenue<br />
received <strong>for</strong> services<br />
(Available cash + <strong>In</strong>vestments)/monthly fixed operational<br />
expenditure<br />
52.3% 0.0% 4995.1% 52.3%<br />
17.1% 0.0% 18.1% 17.1%<br />
1.2 0.0 2.3 1.2<br />
31


