

to download the PDF for MFMA Mangaung In ... - Mangaung.co.za
to download the PDF for MFMA Mangaung In ... - Mangaung.co.za
to download the PDF for MFMA Mangaung In ... - Mangaung.co.za

You also want an ePaper? Increase the reach of your titles
YUMPU automatically turns print PDFs into web optimized ePapers that Google loves.
The table below indicates <strong>the</strong> revenue and expenditure by vote, excluding capital transfers and <strong>co</strong>ntributions.<br />
FS000 <strong>Mangaung</strong> - Table C3 Consolidated Monthly Budget Statement - Financial Per<strong>for</strong>mance (revenue and expenditure by municipal vote) - M07<br />
Vote Description 2011/12<br />
Budget Year 2012/13<br />
Audited Original Adjusted Monthly<br />
YearTD YTD YTD Full Year<br />
YearTD actual<br />
Out<strong>co</strong>me Budget Budget actual<br />
budget variance variance Forecast<br />
R thousands %<br />
Revenue by Vote<br />
Vote 1 - City Manager – 2 – 0 0 1 (1) -93.6% 2<br />
Vote 2 - Executive Mayor – – – – – – – –<br />
Vote 3 - Corporate Services – 10,164 – 2,612 3,879 5,929 (2,049) -34.6% 10,164<br />
Vote 4 - Finance – 961,591 – 51,834 686,024 560,896 125,128 22.3% 961,591<br />
Vote 5 - Social Services – 32,546 – 704 6,943 18,984 (12,041) -63.4% 32,546<br />
Vote 6 - Planning – 5,373 – 262 2,904 3,134 (230) -7.3% 5,373<br />
Vote 7 - Human Settlement and Housing – 31,793 – 832 6,142 18,545 (12,403) -66.9% 31,793<br />
Vote 8 - Fresh Produce Market – 20,561 – 3,370 11,206 11,993 (787) -6.6% 20,561<br />
Vote 9 - Engineering Services – 256,040 – 16,261 181,291 149,348 31,942 21.4% 256,040<br />
Vote 10 - Water Services – 610,174 – 51,639 361,317 355,914 5,402 1.5% 610,174<br />
Vote 11 - Miscellaneous Services – 1,105,739 – 19,989 303,690 644,978 (341,288) -52.9% 1,105,739<br />
Vote 12 - Regional Operations – – – – – – – –<br />
Vote 13 - Strategic Projects and Service Delivery Regulation – 5 – – – 3 (3) -100.0% 5<br />
Vote 14 - Electricity - Centlec (Soc) Ltd – 1,854,328 – 135,460 1,065,568 1,081,629 (16,061) -1.5% 1,854,328<br />
Vote 15 - [NAME OF VOTE 15] – – – – – – – –<br />
Total Revenue by Vote – 4,888,315 – 282,964 2,628,964 2,851,354 (222,390) -7.8% 4,888,315<br />
Expenditure by Vote<br />
Vote 1 - City Manager – 43,788 – 2,202 17,094 25,541 (8,448) -33.1% 43,788<br />
Vote 2 - Executive Mayor – 134,047 – 10,567 70,913 78,190 (7,276) -9.3% 134,047<br />
Vote 3 - Corporate Services – 206,889 – 9,685 90,620 120,679 (30,058) -24.9% 206,889<br />
Vote 4 - Finance – 133,283 – 12,591 79,900 77,744 2,156 2.8% 133,283<br />
Vote 5 - Social Services – 288,852 – 14,157 144,801 168,488 (23,687) -14.1% 288,852<br />
Vote 6 - Planning – 85,190 – 3,323 26,857 49,691 (22,834) -46.0% 85,190<br />
Vote 7 - Human Settlement and Housing – 80,507 – (4,020) 28,523 46,960 (18,436) -39.3% 80,507<br />
Vote 8 - Fresh Produce Market – 13,861 – 258 5,943 8,085 (2,142) -26.5% 13,861<br />
Vote 9 - Engineering Services – 429,750 – 5,517 187,367 250,673 (63,306) -25.3% 429,750<br />
Vote 10 - Water Services – 518,065 – 38,793 274,664 302,187 (27,524) -9.1% 518,065<br />
Vote 11 - Miscellaneous Services – 536,581 – (13,947) 54,369 312,988 (258,618) -82.6% 536,581<br />
Vote 12 - Regional Operations – – – – – – – –<br />
Vote 13 - Strategic Projects and Service Delivery Regulation – 37,852 – 2,416 13,768 22,079 (8,311) -37.6% 37,852<br />
Vote 14 - Electricity - Centlec (Soc) Ltd – 1,667,649 – 93,447 791,300 972,739 (181,439) -18.7% 1,667,649<br />
Vote 15 - [NAME OF VOTE 15] – – – – – – – –<br />
Total Expenditure by Vote – 4,176,315 – 174,988 1,786,119 2,436,044 (649,925) -26.7% 4,176,315<br />
Surplus/ (Deficit) <strong>for</strong> <strong>the</strong> year – 712,001 – 107,976 842,845 415,310 427,535 102.9% 712,001<br />
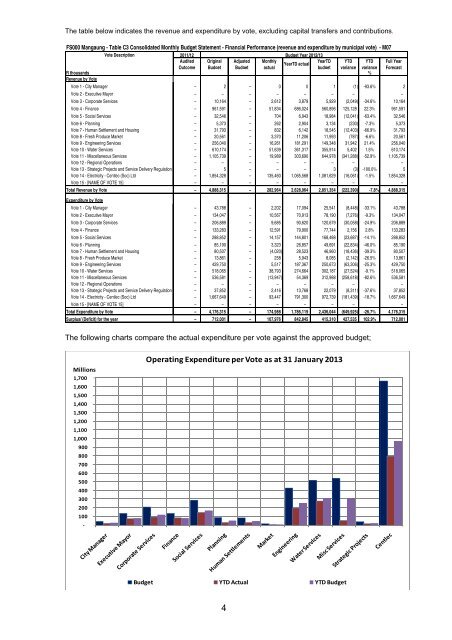
The following charts <strong>co</strong>mpare <strong>the</strong> actual expenditure per vote against <strong>the</strong> approved budget;<br />
Millions<br />
1,700<br />
1,600<br />
1,500<br />
1,400<br />
1,300<br />
1,200<br />
1,100<br />
1,000<br />
900<br />
800<br />
700<br />
600<br />
500<br />
400<br />
300<br />
200<br />
100<br />
‐<br />
Operating Expenditure per Vote as at 31 January 2013<br />
Budget YTD Actual YTD Budget<br />
4


