

to download the PDF for MFMA Mangaung In ... - Mangaung.co.za
to download the PDF for MFMA Mangaung In ... - Mangaung.co.za
to download the PDF for MFMA Mangaung In ... - Mangaung.co.za

You also want an ePaper? Increase the reach of your titles
YUMPU automatically turns print PDFs into web optimized ePapers that Google loves.
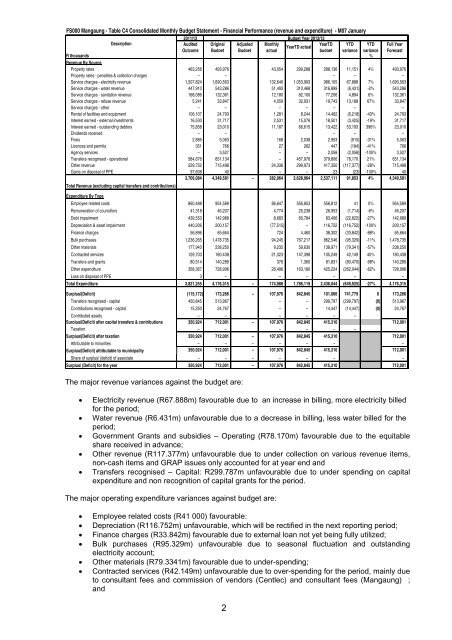
FS000 <strong>Mangaung</strong> - Table C4 Consolidated Monthly Budget Statement - Financial Per<strong>for</strong>mance (revenue and expenditure) - M07 January<br />
2011/12<br />
Budget Year 2012/13<br />
Description<br />
Audited Original Adjusted Monthly<br />
YearTD YTD YTD Full Year<br />
YearTD actual<br />
Out<strong>co</strong>me Budget Budget actual<br />
budget variance variance Forecast<br />
R thousands %<br />
Revenue By Source<br />
Property rates 463,256 493,976 43,054 299,288 288,136 11,151 4% 493,976<br />
Property rates - penalties & <strong>co</strong>llection charges – – – – –<br />
Service charges - electricity revenue 1,507,824 1,690,563 132,646 1,053,993 986,105 67,888 7% 1,690,563<br />
Service charges - water revenue 447,910 543,286 51,493 310,468 316,899 (6,431) -2% 543,286<br />
Service charges - sanitation revenue 168,086 132,361 12,180 82,100 77,206 4,894 6% 132,361<br />
Service charges - refuse revenue 5,241 33,847 4,059 32,931 19,743 13,188 67% 33,847<br />
Service charges - o<strong>the</strong>r – – – – – – –<br />
Rental of facilities and equipment 106,107 24,793 1,281 8,244 14,462 (6,218) -43% 24,793<br />
<strong>In</strong>terest earned - external investments 16,530 31,717 2,531 15,076 18,501 (3,425) -19% 31,717<br />
<strong>In</strong>terest earned - outstanding deb<strong>to</strong>rs 75,858 23,010 11,187 66,615 13,422 53,193 396% 23,010<br />
Dividends received – – – – –<br />
Fines 2,885 5,063 168 2,038 2,953 (915) -31% 5,063<br />
Licences and permits 351 766 27 262 447 (184) -41% 766<br />
Agency services – 3,527 – – 2,058 (2,058) -100% 3,527<br />
Transfers re<strong>co</strong>gnised - operational 584,676 651,134 – 457,976 379,806 78,170 21% 651,134<br />
O<strong>the</strong>r revenue 229,752 715,498 24,336 299,973 417,350 (117,377) -28% 715,498<br />
Gains on disposal of PPE 97,608 40 – – 23 (23) -100% 40<br />
3,706,084 4,349,581 – 282,964 2,628,964 2,537,111 91,853 4% 4,349,581<br />
Total Revenue (excluding capital transfers and <strong>co</strong>ntributions)<br />
Expenditure By Type<br />
Employee related <strong>co</strong>sts 860,488 954,589 86,647 556,853 556,812 41 0% 954,589<br />
Remuneration of <strong>co</strong>uncillors 41,318 46,207 4,774 25,238 26,953 (1,714) -6% 46,207<br />
Debt impairment 439,553 142,989 8,683 60,784 83,406 (22,622) -27% 142,989<br />
Depreciation & asset impairment 440,206 200,157 (77,515) – 116,752 (116,752) -100% 200,157<br />
Finance charges 56,896 65,664 724 4,460 38,302 (33,842) -88% 65,664<br />
Bulk purchases 1,236,265 1,478,735 94,245 767,217 862,546 (95,329) -11% 1,478,735<br />
O<strong>the</strong>r materials 177,943 238,250 9,235 59,630 138,971 (79,341) -57% 238,250<br />
Contracted services 129,703 180,438 21,323 147,398 105,249 42,149 40% 180,438<br />
Transfers and grants 80,514 140,289 376 1,360 81,831 (80,470) -98% 140,289<br />
O<strong>the</strong>r expenditure 358,367 728,996 26,496 163,180 425,224 (262,044) -62% 728,996<br />
Loss on disposal of PPE 3 – – – – – –<br />
Total Expenditure 3,821,255 4,176,315 – 174,988 1,786,119 2,436,044 (649,925) -27% 4,176,315<br />
Surplus/(Deficit) (115,172) 173,266 – 107,976 842,845 101,066 741,779 0 173,266<br />
Transfers re<strong>co</strong>gnised - capital 450,845 513,967 – – 299,797 (299,797) (0) 513,967<br />
Contributions re<strong>co</strong>gnised - capital 15,250 24,767 – – 14,447 (14,447) (0) 24,767<br />
Contributed assets – – – – – –<br />
Surplus/(Deficit) after capital transfers & <strong>co</strong>ntributions 350,924 712,001 – 107,976 842,845 415,310 712,001<br />
Taxation – – – – – –<br />
Surplus/(Deficit) after taxation 350,924 712,001 – 107,976 842,845 415,310 712,001<br />
Attributable <strong>to</strong> minorities – – – – – – –<br />
Surplus/(Deficit) attributable <strong>to</strong> municipality 350,924 712,001 – 107,976 842,845 415,310 712,001<br />
Share of surplus/ (deficit) of associate – – – – – – –<br />
Surplus/ (Deficit) <strong>for</strong> <strong>the</strong> year 350,924 712,001 – 107,976 842,845 415,310 712,001<br />
The major revenue variances against <strong>the</strong> budget are:<br />
<br />
<br />
<br />
<br />
<br />
Electricity revenue (R67.888m) favourable due <strong>to</strong> an increase in billing, more electricity billed<br />
<strong>for</strong> <strong>the</strong> period;<br />
Water revenue (R6.431m) unfavourable due <strong>to</strong> a decrease in billing, less water billed <strong>for</strong> <strong>the</strong><br />
period;<br />
Government Grants and subsidies – Operating (R78.170m) favourable due <strong>to</strong> <strong>the</strong> equitable<br />
share received in advance;<br />
O<strong>the</strong>r revenue (R117.377m) unfavourable due <strong>to</strong> under <strong>co</strong>llection on various revenue items,<br />
non-cash items and GRAP issues only ac<strong>co</strong>unted <strong>for</strong> at year end and<br />
Transfers re<strong>co</strong>gnised – Capital: R299.787m unfavourable due <strong>to</strong> under spending on capital<br />
expenditure and non re<strong>co</strong>gnition of capital grants <strong>for</strong> <strong>the</strong> period.<br />
The major operating expenditure variances against budget are:<br />
Employee related <strong>co</strong>sts (R41 000) favourable:<br />
Depreciation (R116.752m) unfavourable, which will be rectified in <strong>the</strong> next reporting period;<br />
Finance charges (R33.842m) favourable due <strong>to</strong> external loan not yet being fully utilized;<br />
Bulk purchases (R95.329m) unfavourable due <strong>to</strong> seasonal fluctuation and outstanding<br />
electricity ac<strong>co</strong>unt;<br />
O<strong>the</strong>r materials (R79.3341m) favourable due <strong>to</strong> under-spending;<br />
Contracted services (R42.149m) unfavourable due <strong>to</strong> over-spending <strong>for</strong> <strong>the</strong> period, mainly due<br />
<strong>to</strong> <strong>co</strong>nsultant fees and <strong>co</strong>mmission of vendors (Centlec) and <strong>co</strong>nsultant fees (<strong>Mangaung</strong>) ;<br />
and<br />
2


