

to download the PDF for MFMA Mangaung In ... - Mangaung.co.za
to download the PDF for MFMA Mangaung In ... - Mangaung.co.za
to download the PDF for MFMA Mangaung In ... - Mangaung.co.za

Create successful ePaper yourself
Turn your PDF publications into a flip-book with our unique Google optimized e-Paper software.
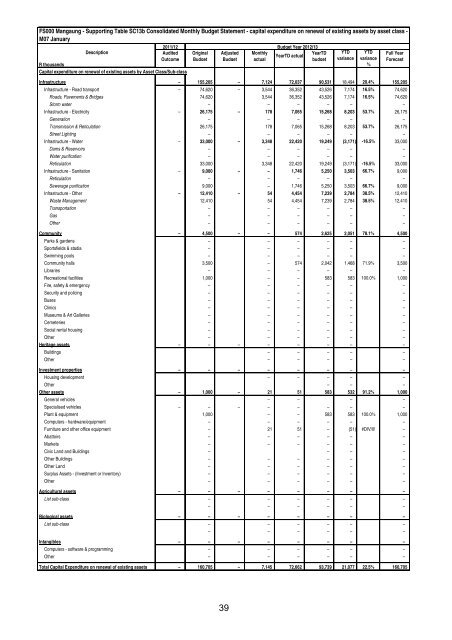
FS000 <strong>Mangaung</strong> - Supporting Table SC13b Consolidated Monthly Budget Statement - capital expenditure on renewal of existing assets by asset class -<br />
M07 January<br />
2011/12 Budget Year 2012/13<br />
Description<br />
Audited Original Adjusted Monthly<br />
YearTD YTD YTD Full Year<br />
YearTD actual<br />
Out<strong>co</strong>me Budget Budget actual<br />
budget variance variance Forecast<br />
R thousands %<br />
Capital expenditure on renewal of existing assets by Asset Class/Sub-class<br />
<strong>In</strong>frastructure – 155,205 – 7,124 72,037 90,531 18,494 20.4% 155,205<br />
<strong>In</strong>frastructure - Road transport – 74,620 – 3,544 36,352 43,526 7,174 16.5% 74,620<br />
Roads, Pavements & Bridges 74,620 3,544 36,352 43,526 7,174 16.5% 74,620<br />
S<strong>to</strong>rm water – – – – – –<br />
<strong>In</strong>frastructure - Electricity – 26,175 – 178 7,065 15,268 8,203 53.7% 26,175<br />
Generation – – – – – –<br />
Transmission & Reticulation 26,175 178 7,065 15,268 8,203 53.7% 26,175<br />
Street Lighting – – – – – –<br />
<strong>In</strong>frastructure - Water – 33,000 – 3,348 22,420 19,249 (3,171) -16.5% 33,000<br />
Dams & Reservoirs – – – – – –<br />
Water purification – – – – – –<br />
Reticulation 33,000 3,348 22,420 19,249 (3,171) -16.5% 33,000<br />
<strong>In</strong>frastructure - Sanitation – 9,000 – – 1,746 5,250 3,503 66.7% 9,000<br />
Reticulation – – – – – –<br />
Sewerage purification 9,000 – 1,746 5,250 3,503 66.7% 9,000<br />
<strong>In</strong>frastructure - O<strong>the</strong>r – 12,410 – 54 4,454 7,239 2,784 38.5% 12,410<br />
Waste Management 12,410 54 4,454 7,239 2,784 38.5% 12,410<br />
Transportation – – – – – –<br />
Gas – – – – – –<br />
O<strong>the</strong>r – – – – – –<br />
Community – 4,500 – – 574 2,625 2,051 78.1% 4,500<br />
Parks & gardens – – – – – –<br />
Sportsfields & stadia – – – – – –<br />
Swimming pools – – – – – –<br />
Community halls 3,500 – 574 2,042 1,468 71.9% 3,500<br />
Libraries – – – – – –<br />
Recreational facilities 1,000 – – 583 583 100.0% 1,000<br />
Fire, safety & emergency – – – – – –<br />
Security and policing – – – – – –<br />
Buses – – – – – –<br />
Clinics – – – – – –<br />
Museums & Art Galleries – – – – – –<br />
Cemeteries – – – – – –<br />
Social rental housing – – – – – –<br />
O<strong>the</strong>r – – – – – –<br />
Heritage assets – – – – – – – –<br />
Buildings – – – – –<br />
O<strong>the</strong>r – – – –<br />
–<br />
<strong>In</strong>vestment properties – – – – – – – –<br />
Housing development – – – – –<br />
O<strong>the</strong>r – – –<br />
O<strong>the</strong>r assets – 1,000 – 21 51 583 532 91.2% 1,000<br />
General vehicles – – – –<br />
Specialised vehicles – – – – – – – –<br />
Plant & equipment 1,000 – – 583 583 100.0% 1,000<br />
Computers - hardware/equipment – – – – – –<br />
Furniture and o<strong>the</strong>r office equipment – 21 51 – (51) #DIV/0! –<br />
Abat<strong>to</strong>irs – – – – – –<br />
Markets – – – – – –<br />
Civic Land and Buildings – – – –<br />
O<strong>the</strong>r Buildings – – – – – –<br />
O<strong>the</strong>r Land – – – – – –<br />
Surplus Assets - (<strong>In</strong>vestment or <strong>In</strong>ven<strong>to</strong>ry) – – – – – –<br />
O<strong>the</strong>r – – – – – –<br />
Agricultural assets – – – – – – – –<br />
List sub-class – – – – – –<br />
– – – – – –<br />
Biological assets – – – – – – – –<br />
List sub-class – – – – – –<br />
– – – – – –<br />
<strong>In</strong>tangibles – – – – – – – –<br />
Computers - software & programming – – – – – –<br />
O<strong>the</strong>r – – – – – –<br />
Total Capital Expenditure on renewal of existing assets – 160,705 – 7,145 72,662 93,739 21,077 22.5% 160,705<br />
39


