FS000 <strong>Mangaung</strong> - Supporting Table SC10 Monthly Budget Statement - Parent Municipality Financial Per<strong>for</strong>mance (revenue and expenditure) - M07 Januar 2011/12 Budget Year 2012/13 Description Audited Original Adjusted Monthly YearTD YTD YTD Full Year YearTD actual Out<strong>co</strong>me Budget Budget actual budget variance variance Forecast R thousands % Revenue By Source Property rates 493,976 43,054 299,288 288,136 11,151 4% 493,976 Property rates - penalties & <strong>co</strong>llection charges – – – – – – Service charges - electricity revenue – – – – – – Service charges - water revenue 543,286 51,493 310,468 316,899 (6,431) -2% 543,286 Service charges - sanitation revenue 132,361 12,180 82,100 77,206 4,894 6% 132,361 Service charges - refuse revenue 33,847 4,059 32,931 19,743 13,188 67% 33,847 Service charges - o<strong>the</strong>r – – – – – – Rental of facilities and equipment 24,793 1,281 8,244 14,462 (6,218) -43% 24,793 <strong>In</strong>terest earned - external investments 31,717 2,243 13,587 18,501 (4,914) -27% 31,717 <strong>In</strong>terest earned - outstanding deb<strong>to</strong>rs 23,010 8,683 57,100 13,422 43,678 325% 23,010 Dividends received 110,000 9,167 64,167 64,163 4 0% 110,000 Fines 5,063 168 2,038 2,953 (915) -31% 5,063 Licences and permits 766 27 262 447 (184) -41% 766 Agency services 156,024 8,578 53,410 91,009 (37,599) -41% 156,024 Transfers re<strong>co</strong>gnised - operational 651,134 – 457,976 379,806 78,170 21% 651,134 O<strong>the</strong>r revenue 314,043 6,569 181,825 183,181 (1,357) -1% 314,043 Gains on disposal of PPE – – – – – – Total Revenue (excluding capital transfers and <strong>co</strong>ntributions) – 2,520,021 – 147,504 1,563,396 1,469,928 93,468 6% 2,520,021 Expenditure By Type Employee related <strong>co</strong>sts 802,628 70,770 465,291 468,173 (2,882) -1% 802,628 Remuneration of <strong>co</strong>uncillors 44,938 4,774 25,238 26,212 (974) -4% 44,938 Debt impairment 104,201 8,683 60,784 60,780 3 0% 104,201 Depreciation & asset impairment 155,030 (77,515) – 90,429 (90,429) -100% 155,030 Finance charges 47,510 724 4,460 27,713 (23,253) -84% 47,510 Bulk purchases 329,315 30,556 182,411 192,089 (9,678) -5% 329,315 O<strong>the</strong>r materials 190,140 6,227 36,465 110,909 (74,444) -67% 190,140 Contracted services 323,579 16,136 84,627 188,743 (104,116) -55% 323,579 Transfers and grants 2,004 376 1,346 1,169 177 15% 2,004 O<strong>the</strong>r expenditure 509,323 20,811 134,197 297,088 (162,891) -55% 509,323 Loss on disposal of PPE – – – – – – Total Expenditure – 2,508,666 – 81,541 994,819 1,463,305 (468,486) – -32% 2,508,666 Surplus/(Deficit) – 11,355 – 65,963 568,577 6,623 561,954 8485% 11,355 Transfers re<strong>co</strong>gnised - capital 513,967 – – 299,797 (299,797) -100% 513,967 Contributions re<strong>co</strong>gnised - capital – – – – – – Contributed assets – – – – – – Surplus/(Deficit) after capital transfers & <strong>co</strong>ntributions – 525,322 – 65,963 568,577 306,420 262,157 86% 525,322 Taxation – Surplus/(Deficit) after taxation – 525,322 – 65,963 568,577 306,420 262,157 86% 525,322 FS000 <strong>Mangaung</strong> - Supporting Table SC11 Monthly Budget Statement - summary of municipal entities - M07 January 2011/12 Budget Year 2012/13 Description Audited Original Adjusted Monthly YearTD YTD YTD Full Year YearTD actual Out<strong>co</strong>me Budget Budget actual budget variance variance Forecast R thousands % Revenue By Municipal Entity Centlec (SOC) LTD 1,854,328 – 135,460 1,065,568 1,081,629 (16,061) -1% 1,854,328 Total Operating Revenue – 1,854,328 – 135,460 1,065,568 1,081,629 (16,061) -1% 1,854,328 Expenditure By Municipal Entity Centlec (SOC) LTD 1,667,649 – 93,447 791,300 972,739 (181,439) -19% 1,667,649 Total Operating Expenditure – 1,667,649 – 93,447 791,300 972,739 (181,439) -19% 1,667,649 Surplus/ (Deficit) <strong>for</strong> <strong>the</strong> yr/period – 186,679 – 42,013 274,268 108,890 (197,500) -181% 186,679 Capital Expenditure By Municipal Entity Centlec (SOC) LTD 184,767 – 18,901 86,027 107,775 (21,748) -20% 184,767 Total Capital Expenditure – 184,767 – 18,901 86,027 107,775 (21,748) -20% 184,767 36
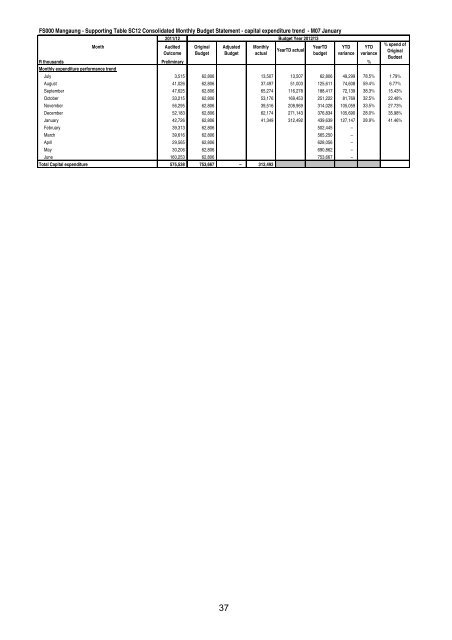
FS000 <strong>Mangaung</strong> - Supporting Table SC12 Consolidated Monthly Budget Statement - capital expenditure trend - M07 January 2011/12 Budget Year 2012/13 Month Audited Original Adjusted Monthly YearTD YTD YearTD actual Out<strong>co</strong>me Budget Budget actual budget variance YTD variance % spend of Original Budget R thousands Preliminary % Monthly expenditure per<strong>for</strong>mance trend July 3,515 62,806 13,507 13,507 62,806 49,299 78.5% 1.79% August 41,026 62,806 37,497 51,003 125,611 74,608 59.4% 6.77% September 47,625 62,806 65,274 116,278 188,417 72,139 38.3% 15.43% Oc<strong>to</strong>ber 33,215 62,806 53,176 169,453 251,222 81,769 32.5% 22.48% November 56,295 62,806 39,516 208,969 314,028 105,059 33.5% 27.73% December 52,183 62,806 62,174 271,143 376,834 105,690 28.0% 35.98% January 42,726 62,806 41,349 312,492 439,639 127,147 28.9% 41.46% February 39,313 62,806 502,445 – March 39,616 62,806 565,250 – April 29,565 62,806 628,056 – May 30,206 62,806 690,862 – June 160,253 62,806 753,667 – Total Capital expenditure 575,538 753,667 – 312,492 37