

to download the PDF for MFMA Mangaung In ... - Mangaung.co.za
to download the PDF for MFMA Mangaung In ... - Mangaung.co.za
to download the PDF for MFMA Mangaung In ... - Mangaung.co.za

You also want an ePaper? Increase the reach of your titles
YUMPU automatically turns print PDFs into web optimized ePapers that Google loves.
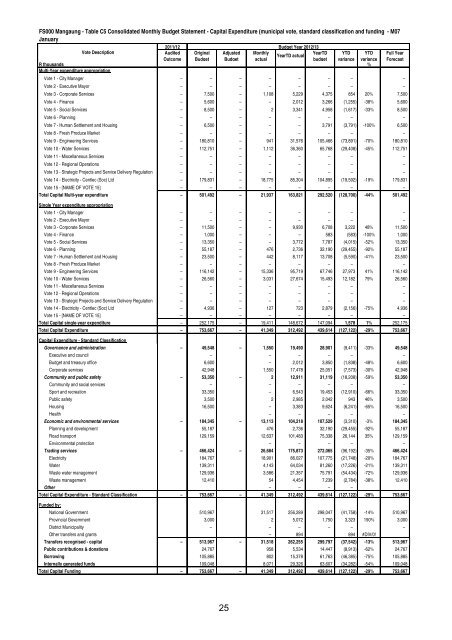
FS000 <strong>Mangaung</strong> - Table C5 Consolidated Monthly Budget Statement - Capital Expenditure (municipal vote, standard classification and funding - M07<br />
January<br />
2011/12 Budget Year 2012/13<br />
Vote Description<br />
Audited Original Adjusted Monthly<br />
YearTD YTD YTD Full Year<br />
YearTD actual<br />
Out<strong>co</strong>me Budget Budget actual<br />
budget variance variance Forecast<br />
R thousands %<br />
Multi-Year expenditure appropriation<br />
Vote 1 - City Manager – – – – – – – –<br />
Vote 2 - Executive Mayor – – – – – – – –<br />
Vote 3 - Corporate Services – 7,500 – 1,108 5,229 4,375 854 20% 7,500<br />
Vote 4 - Finance – 5,600 – – 2,012 3,266 (1,255) -38% 5,600<br />
Vote 5 - Social Services – 8,500 – 2 3,341 4,958 (1,617) -33% 8,500<br />
Vote 6 - Planning – – – – – – – –<br />
Vote 7 - Human Settlement and Housing – 6,500 – – – 3,791 (3,791) -100% 6,500<br />
Vote 8 - Fresh Produce Market – – – – – – – –<br />
Vote 9 - Engineering Services – 180,810 – 941 31,576 105,466 (73,891) -70% 180,810<br />
Vote 10 - Water Services – 112,751 – 1,112 36,360 65,768 (29,408) -45% 112,751<br />
Vote 11 - Miscellaneous Services – – – – – – – –<br />
Vote 12 - Regional Operations – – – – – – – –<br />
Vote 13 - Strategic Projects and Service Delivery Regulation – – – – – – – –<br />
Vote 14 - Electricity - Centlec (Soc) Ltd – 179,831 – 18,775 85,304 104,895 (19,592) -19% 179,831<br />
Vote 15 - [NAME OF VOTE 15] – – – – – – – –<br />
Total Capital Multi-year expenditure – 501,492 – 21,937 163,821 292,520 (128,700) -44% 501,492<br />
Single Year expenditure appropriation<br />
Vote 1 - City Manager – – – – – – – –<br />
Vote 2 - Executive Mayor – – – – – – – –<br />
Vote 3 - Corporate Services – 11,500 – – 9,930 6,708 3,222 48% 11,500<br />
Vote 4 - Finance – 1,000 – – – 583 (583) -100% 1,000<br />
Vote 5 - Social Services – 13,350 – – 3,772 7,787 (4,015) -52% 13,350<br />
Vote 6 - Planning – 55,187 – 476 2,736 32,190 (29,455) -92% 55,187<br />
Vote 7 - Human Settlement and Housing – 23,500 – 442 8,117 13,708 (5,590) -41% 23,500<br />
Vote 8 - Fresh Produce Market – – – – – – – –<br />
Vote 9 - Engineering Services – 116,142 – 15,336 95,719 67,746 27,973 41% 116,142<br />
Vote 10 - Water Services – 26,560 – 3,031 27,674 15,493 12,182 79% 26,560<br />
Vote 11 - Miscellaneous Services – – – – – – – –<br />
Vote 12 - Regional Operations – – – – – – – –<br />
Vote 13 - Strategic Projects and Service Delivery Regulation – – – – – – – –<br />
Vote 14 - Electricity - Centlec (Soc) Ltd – 4,936 – 127 723 2,879 (2,156) -75% 4,936<br />
Vote 15 - [NAME OF VOTE 15] – – – – – – – –<br />
Total Capital single-year expenditure – 252,175 – 19,411 148,672 147,094 1,578 1% 252,175<br />
Total Capital Expenditure – 753,667 – 41,349 312,492 439,614 (127,122) -29% 753,667<br />
Capital Expenditure - Standard Classification<br />
Governance and administration – 49,548 – 1,550 19,490 28,901 (9,411) -33% 49,548<br />
Executive and <strong>co</strong>uncil – – – – – –<br />
Budget and treasury office 6,600 – 2,012 3,850 (1,838) -48% 6,600<br />
Corporate services 42,948 1,550 17,478 25,051 (7,573) -30% 42,948<br />
Community and public safety – 53,350 – 2 12,911 31,119 (18,208) -59% 53,350<br />
Community and social services – – – – – –<br />
Sport and recreation 33,350 – 6,543 19,453 (12,910) -66% 33,350<br />
Public safety 3,500 2 2,985 2,042 943 46% 3,500<br />
Housing 16,500 – 3,383 9,624 (6,241) -65% 16,500<br />
Health – – – – –<br />
E<strong>co</strong>nomic and environmental services – 184,345 – 13,113 104,218 107,529 (3,310) -3% 184,345<br />
Planning and development 55,187 476 2,736 32,190 (29,455) -92% 55,187<br />
Road transport 129,159 12,637 101,483 75,338 26,144 35% 129,159<br />
Environmental protection – – – – –<br />
Trading services – 466,424 – 26,684 175,873 272,065 (96,192) -35% 466,424<br />
Electricity 184,767 18,901 86,027 107,775 (21,748) -20% 184,767<br />
Water 139,311 4,143 64,034 81,260 (17,226) -21% 139,311<br />
Waste water management 129,936 3,586 21,357 75,791 (54,434) -72% 129,936<br />
Waste management 12,410 54 4,454 7,239 (2,784) -38% 12,410<br />
O<strong>the</strong>r – – – –<br />
Total Capital Expenditure - Standard Classification – 753,667 – 41,349 312,492 439,614 (127,122) -29% 753,667<br />
Funded by:<br />
National Government 510,967 31,517 256,289 298,047 (41,758) -14% 510,967<br />
Provincial Government 3,000 2 5,072 1,750 3,323 190% 3,000<br />
District Municipality – – – – – –<br />
O<strong>the</strong>r transfers and grants – 894 894 #DIV/0!<br />
Transfers re<strong>co</strong>gnised - capital – 513,967 – 31,518 262,255 299,797 (37,542) -13% 513,967<br />
Public <strong>co</strong>ntributions & donations 24,767 958 5,534 14,447 (8,913) -62% 24,767<br />
Borrowing 105,885 802 15,378 61,763 (46,385) -75% 105,885<br />
<strong>In</strong>ternally generated funds 109,048 8,071 29,326 63,607 (34,282) -54% 109,048<br />
Total Capital Funding – 753,667 – 41,349 312,492 439,614 (127,122) -29% 753,667<br />
25


