

to download the PDF for MFMA Mangaung In ... - Mangaung.co.za
to download the PDF for MFMA Mangaung In ... - Mangaung.co.za
to download the PDF for MFMA Mangaung In ... - Mangaung.co.za

You also want an ePaper? Increase the reach of your titles
YUMPU automatically turns print PDFs into web optimized ePapers that Google loves.
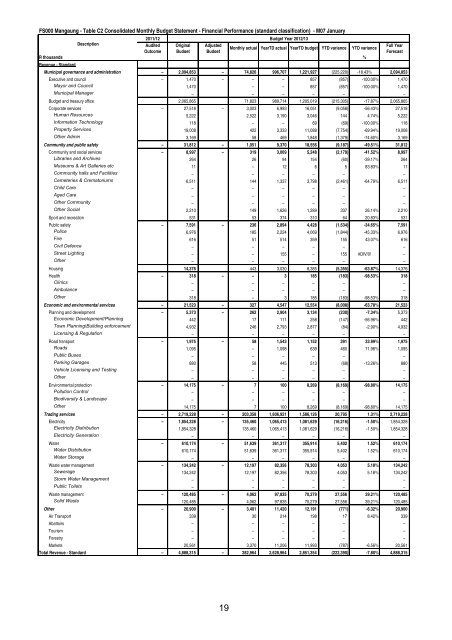
FS000 <strong>Mangaung</strong> - Table C2 Consolidated Monthly Budget Statement - Financial Per<strong>for</strong>mance (standard classification) - M07 January<br />
2011/12 Budget Year 2012/13<br />
Description<br />
Audited Original Adjusted<br />
Full Year<br />
Monthly actual YearTD actual YearTD budget YTD variance YTD variance<br />
Out<strong>co</strong>me Budget Budget<br />
Forecast<br />
R thousands %<br />
Revenue - Standard<br />
Municipal governance and administration – 2,094,853 – 74,826 996,707 1,221,927 (225,220) -18.43% 2,094,853<br />
Executive and <strong>co</strong>uncil – 1,470 – – – 857 (857) -100.00% 1,470<br />
Mayor and Council 1,470 – – 857 (857) -100.00% 1,470<br />
Municipal Manager – – – – – –<br />
Budget and treasury office 2,065,865 71,823 989,714 1,205,019 (215,305) -17.87% 2,065,865<br />
Corporate services – 27,518 – 3,003 6,993 16,051 (9,058) -56.43% 27,518<br />
Human Resources 5,222 2,522 3,190 3,046 144 4.74% 5,222<br />
<strong>In</strong><strong>for</strong>mation Technology 118 – – 69 (69) -100.00% 118<br />
Property Services 19,008 422 3,333 11,088 (7,754) -69.94% 19,008<br />
O<strong>the</strong>r Admin 3,169 58 469 1,848 (1,379) -74.60% 3,169<br />
Community and public safety – 31,812 – 1,051 9,370 18,556 (9,187) -49.51% 31,812<br />
Community and social services – 8,997 – 319 3,069 5,248 (2,179) -41.52% 8,997<br />
Libraries and Archives 264 26 94 154 (60) -39.17% 264<br />
Museums & Art Galleries etc 11 – 12 6 5 83.83% 11<br />
Community halls and Facilities – – – – – –<br />
Cemeteries & Crema<strong>to</strong>riums 6,511 144 1,337 3,798 (2,461) -64.79% 6,511<br />
Child Care – – – – – –<br />
Aged Care – – – – – –<br />
O<strong>the</strong>r Community – – – – – –<br />
O<strong>the</strong>r Social 2,210 149 1,626 1,289 337 26.14% 2,210<br />
Sport and recreation 531 53 374 310 64 20.83% 531<br />
Public safety – 7,591 – 236 2,894 4,428 (1,534) -34.65% 7,591<br />
Police 6,976 185 2,224 4,069 (1,844) -45.33% 6,976<br />
Fire 616 51 514 359 155 43.07% 616<br />
Civil Defence – – – – – –<br />
Street Lighting – – 155 – 155 #DIV/0! –<br />
O<strong>the</strong>r – – – – – –<br />
Housing 14,376 443 3,030 8,385 (5,355) -63.87% 14,376<br />
Health – 318 – – 3 185 (183) -98.53% 318<br />
Clinics – – – – – –<br />
Ambulance – – – – – –<br />
O<strong>the</strong>r 318 – 3 185 (183) -98.53% 318<br />
E<strong>co</strong>nomic and environmental services – 21,523 – 327 4,547 12,554 (8,008) -63.78% 21,523<br />
Planning and development – 5,373 – 262 2,904 3,134 (230) -7.34% 5,373<br />
E<strong>co</strong>nomic Development/Planning 442 17 111 258 (147) -56.96% 442<br />
Town Planning/Building en<strong>for</strong>cement 4,932 246 2,793 2,877 (84) -2.90% 4,932<br />
Licensing & Regulation – – – – – –<br />
Road transport – 1,975 – 58 1,543 1,152 391 33.99% 1,975<br />
Roads 1,095 – 1,098 639 460 71.96% 1,095<br />
Public Buses – – – – – –<br />
Parking Garages 880 58 445 513 (68) -13.26% 880<br />
Vehicle Licensing and Testing – – – – – –<br />
O<strong>the</strong>r – – – – – –<br />
Environmental protection – 14,175 – 7 100 8,269 (8,169) -98.80% 14,175<br />
Pollution Control – – – – – –<br />
Biodiversity & Landscape – – – – – –<br />
O<strong>the</strong>r 14,175 7 100 8,269 (8,169) -98.80% 14,175<br />
Trading services – 2,719,228 – 203,358 1,606,921 1,586,126 20,795 1.31% 2,719,228<br />
Electricity – 1,854,328 – 135,460 1,065,413 1,081,629 (16,216) -1.50% 1,854,328<br />
Electricity Distribution 1,854,328 135,460 1,065,413 1,081,629 (16,216) -1.50% 1,854,328<br />
Electricity Generation – – – – – –<br />
Water – 610,174 – 51,639 361,317 355,914 5,402 1.52% 610,174<br />
Water Distribution 610,174 51,639 361,317 355,914 5,402 1.52% 610,174<br />
Water S<strong>to</strong>rage – – – – – –<br />
Waste water management – 134,242 – 12,197 82,356 78,303 4,053 5.18% 134,242<br />
Sewerage 134,242 12,197 82,356 78,303 4,053 5.18% 134,242<br />
S<strong>to</strong>rm Water Management – – – – – –<br />
Public Toilets – – – – – –<br />
Waste management – 120,485 – 4,062 97,835 70,279 27,556 39.21% 120,485<br />
Solid Waste 120,485 4,062 97,835 70,279 27,556 39.21% 120,485<br />
O<strong>the</strong>r – 20,900 – 3,401 11,420 12,191 (771) -6.32% 20,900<br />
Air Transport 339 30 214 198 17 8.42% 339<br />
Abat<strong>to</strong>irs – – – – – –<br />
Tourism – – – – – –<br />
Forestry – – – – – –<br />
Markets 20,561 3,370 11,206 11,993 (787) -6.56% 20,561<br />
Total Revenue - Standard – 4,888,315 – 282,964 2,628,964 2,851,354 (222,390) -7.80% 4,888,315<br />
19


