

to download the PDF for MFMA Mangaung In ... - Mangaung.co.za
to download the PDF for MFMA Mangaung In ... - Mangaung.co.za
to download the PDF for MFMA Mangaung In ... - Mangaung.co.za

Create successful ePaper yourself
Turn your PDF publications into a flip-book with our unique Google optimized e-Paper software.
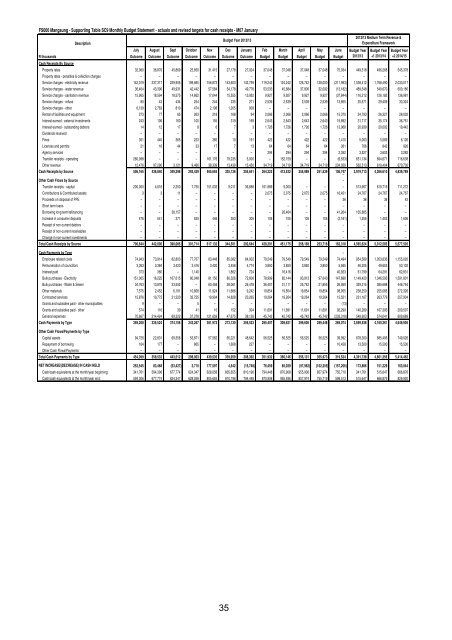
FS000 <strong>Mangaung</strong> - Supporting Table SC9 Monthly Budget Statement - actuals and revised targets <strong>for</strong> cash receipts - M07 January<br />
Description<br />
Budget Year 2012/13<br />
July August Sept Oc<strong>to</strong>ber Nov Dec January Feb March April May June<br />
R thousands Out<strong>co</strong>me Out<strong>co</strong>me Out<strong>co</strong>me Out<strong>co</strong>me Out<strong>co</strong>me Out<strong>co</strong>me Out<strong>co</strong>me Budget Budget Budget Budget Budget<br />
2012/13 Medium Term Revenue &<br />
Expenditure Framework<br />
Cash Receipts By Source<br />
Property rates 32,080 36,876 45,869 25,850 31,415 27,178 27,024 37,048 37,048 37,048 37,048 75,034 449,518 496,268 545,378<br />
Property rates - penalties & <strong>co</strong>llection charges – – – – – – – – – – – – – – –<br />
Service charges - electricity revenue 142,019 237,317 229,905 199,665 156,873 143,600 142,799 119,242 124,242 126,742 128,000 (211,993) 1,538,412 1,768,490 2,033,017<br />
Service charges - water revenue 36,404 43,306 49,931 42,442 57,584 54,178 49,776 53,533 45,684 37,800 32,092 (13,182) 489,548 540,670 600,180<br />
Service charges - sanitation revenue 15,965 18,594 18,575 14,662 17,044 15,555 13,952 9,927 9,927 9,927 9,927 (37,844) 116,212 126,182 136,981<br />
Service charges - refuse 80 43 434 254 244 235 271 2,539 2,539 2,539 2,539 13,855 25,571 29,409 33,324<br />
Service charges - o<strong>the</strong>r 6,139 2,763 810 474 2,198 1,205 909 – – – – – – – –<br />
Rental of facilities and equipment 273 77 65 263 218 168 94 2,066 2,066 2,066 2,066 15,370 24,793 26,327 28,002<br />
<strong>In</strong>terest earned - external investments 243 106 160 100 155 319 169 2,643 2,643 2,643 2,643 19,892 31,717 35,174 36,761<br />
<strong>In</strong>terest earned - outstanding deb<strong>to</strong>rs 14 12 17 8 6 7 3 1,726 1,726 1,726 1,726 13,968 20,939 20,002 19,442<br />
Dividends received – – – – – – – – – – – – – – –<br />
Fines 351 440 365 223 385 10 191 422 422 422 422 1,410 5,063 5,569 6,126<br />
Licences and permits 21 16 44 33 17 7 13 64 64 64 64 361 766 842 926<br />
Agency services – – – – – – – 294 294 294 294 2,352 3,527 3,603 3,282<br />
Transfer receipts - operating 260,098 – – – 161,176 79,235 5,000 – 152,159 – – (6,533) 651,134 694,671 716,638<br />
O<strong>the</strong>r revenue 12,476 97,290 3,121 9,466 38,339 13,439 15,450 34,719 34,719 34,719 34,719 234,059 562,513 619,404 679,730<br />
Cash Receipts by Source 506,165 436,840 349,296 293,439 465,655 335,136 255,651 264,222 413,532 255,989 251,539 106,747<br />
–<br />
3,919,713 4,366,610 4,839,789<br />
O<strong>the</strong>r Cash Flows by Source –<br />
Transfer receipts - capital 200,000 4,616 2,250 7,750 151,032 9,011 36,688 161,989 9,000 – – – 513,967 619,719 711,272<br />
Contributions & Contributed assets 3 3 11 – – – – 2,075 2,075 2,075 2,075 16,451 24,767 24,767 24,767<br />
Proceeds on disposal of PPE – – – – – – – – – – – 36 36 36 42<br />
Short term loans – – – – – – – – – – – – – – –<br />
Borrowing long term/refinancing – – 38,157 – – – – – 26,464 – – 41,264 105,885 – –<br />
<strong>In</strong>crease in <strong>co</strong>nsumer deposits 476 541 371 525 446 353 305 105 105 105 105 (2,181) 1,255 1,453 1,636<br />
Receipt of non-current deb<strong>to</strong>rs – – – – – – – – – – – – – – –<br />
Receipt of non-current receivables – – – – – – – – – – – – – – –<br />
Change in non-current investments – – – – – – – – – – – – – – –<br />
Total Cash Receipts by Source 706,644 442,000 390,085 301,714 617,132 344,501 292,644 428,391 451,175 258,168 253,718 162,318<br />
–<br />
4,565,624 5,012,585 5,577,505<br />
Cash Payments by Type –<br />
Employee related <strong>co</strong>sts 74,943 73,914 82,803 77,707 83,448 85,082 84,002 79,549 79,549 79,549 79,549 74,494 954,589 1,053,836 1,155,020<br />
Remuneration of <strong>co</strong>uncillors 3,363 3,384 3,423 3,416 3,420 3,458 4,774 3,850 3,850 3,850 3,850 5,565 46,205 49,653 53,102<br />
<strong>In</strong>terest paid 373 360 – 1,140 – 1,862 724 – 16,416 40,923 61,799 64,291 62,831<br />
Bulk purchases - Electricity 151,065 16,222 167,615 80,048 81,150 80,326 72,606 78,999 82,144 93,913 97,643 147,688 1,149,420 1,346,593 1,591,801<br />
Bulk purchases - Water & Sewer 34,763 13,878 23,552 – 60,458 28,061 26,478 36,457 31,111 25,742 21,855 26,959 329,315 385,688 446,754<br />
O<strong>the</strong>r materials 7,575 2,452 6,191 10,808 11,924 11,686 9,242 19,854 19,854 19,854 19,854 98,955 238,250 255,085 272,326<br />
Contracted services 15,876 10,773 21,220 32,725 19,904 14,828 23,265 19,264 19,264 19,264 19,264 15,521 231,167 263,779 257,904<br />
Grants and subsidies paid - o<strong>the</strong>r municipalities 9 – – 5 – – – – – – – (13) – – –<br />
Grants and subsidies paid - o<strong>the</strong>r 574 116 30 41 10 152 304 11,691 11,691 11,691 11,691 92,299 140,289 167,393 200,507<br />
General expenses 70,667 214,424 69,322 37,378 121,659 47,675 38,128 45,742 45,742 45,742 45,742 (233,318) 548,903 574,041 609,689<br />
Cash Payments by Type 359,208 335,524 374,156 243,267 381,973 273,130 259,523 295,407 309,621 299,606 299,448 269,074<br />
–<br />
3,699,938 4,160,361 4,649,936<br />
O<strong>the</strong>r Cash Flows/Payments by Type<br />
Capital assets 94,726 22,831 69,356 53,871 57,562 65,221 48,642 56,525 56,525 56,525 56,525 39,992 678,300 685,495 749,026<br />
Repayment of borrowing 164 177 – 865 – 1,608 227 – – – – 10,458 13,500 15,500 15,500<br />
O<strong>the</strong>r Cash Flows/Payments – – – – – – – – – – – – – – –<br />
Total Cash Payments by Type 454,099 358,532 443,512 298,003 439,535 339,959 308,392 351,932 366,146 356,131 355,973 319,524<br />
–<br />
4,391,738 4,861,356 5,414,462<br />
NET INCREASE/(DECREASE) IN CASH HELD 252,545 83,468 (53,427) 3,710 177,597 4,542 (15,748) 76,459 85,029 (97,962) (102,255) (157,206) 173,886 151,229 163,044<br />
Cash/cash equivalents at <strong>the</strong> month/year beginning: 341,761 594,306 677,774 624,347 628,058 805,655 810,196 794,448 870,908 955,936 857,974 755,719 341,761 515,647 666,876<br />
Cash/cash equivalents at <strong>the</strong> month/year end: 594,306 677,774 624,347 628,058 805,655 810,196 794,448 870,908 955,936 857,974 755,719 598,513 515,647 666,876 829,920<br />
Budget Year<br />
2012/13<br />
Budget Year<br />
+1 2013/14<br />
Budget Year<br />
+2 2014/15<br />
35


