

to download the PDF for MFMA Mangaung In ... - Mangaung.co.za
to download the PDF for MFMA Mangaung In ... - Mangaung.co.za
to download the PDF for MFMA Mangaung In ... - Mangaung.co.za

Create successful ePaper yourself
Turn your PDF publications into a flip-book with our unique Google optimized e-Paper software.
Millions<br />
300<br />
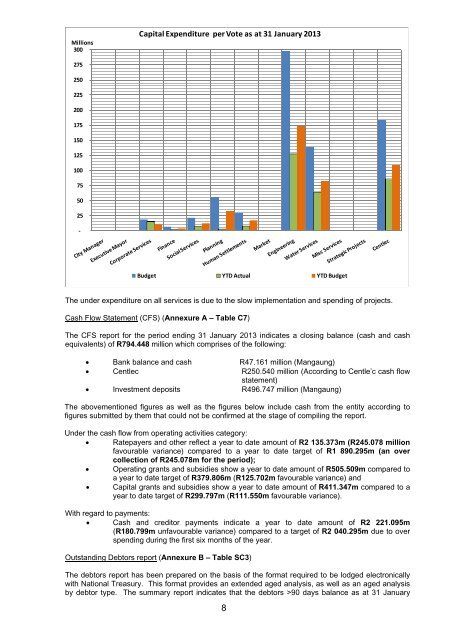
Capital Expenditure per Vote as at 31 January 2013<br />
275<br />
250<br />
225<br />
200<br />
175<br />
150<br />
125<br />
100<br />
75<br />
50<br />
25<br />
‐<br />
Budget YTD Actual YTD Budget<br />
The under expenditure on all services is due <strong>to</strong> <strong>the</strong> slow implementation and spending of projects.<br />
Cash Flow Statement (CFS) (Annexure A – Table C7)<br />
The CFS report <strong>for</strong> <strong>the</strong> period ending 31 January 2013 indicates a closing balance (cash and cash<br />
equivalents) of R794.448 million which <strong>co</strong>mprises of <strong>the</strong> following:<br />
Bank balance and cash R47.161 million (<strong>Mangaung</strong>)<br />
Centlec R250.540 million (Ac<strong>co</strong>rding <strong>to</strong> Centle’c cash flow<br />
statement)<br />
<strong>In</strong>vestment deposits R496.747 million (<strong>Mangaung</strong>)<br />
The abovementioned figures as well as <strong>the</strong> figures below include cash from <strong>the</strong> entity ac<strong>co</strong>rding <strong>to</strong><br />
figures submitted by <strong>the</strong>m that <strong>co</strong>uld not be <strong>co</strong>nfirmed at <strong>the</strong> stage of <strong>co</strong>mpiling <strong>the</strong> report.<br />
Under <strong>the</strong> cash flow from operating activities category:<br />
Ratepayers and o<strong>the</strong>r reflect a year <strong>to</strong> date amount of R2 135.373m (R245.078 million<br />
favourable variance) <strong>co</strong>mpared <strong>to</strong> a year <strong>to</strong> date target of R1 890.295m (an over<br />
<strong>co</strong>llection of R245.078m <strong>for</strong> <strong>the</strong> period);<br />
Operating grants and subsidies show a year <strong>to</strong> date amount of R505.509m <strong>co</strong>mpared <strong>to</strong><br />
a year <strong>to</strong> date target of R379.806m (R125.702m favourable variance) and<br />
Capital grants and subsidies show a year <strong>to</strong> date amount of R411.347m <strong>co</strong>mpared <strong>to</strong> a<br />
year <strong>to</strong> date target of R299.797m (R111.550m favourable variance).<br />
With regard <strong>to</strong> payments:<br />
Cash and credi<strong>to</strong>r payments indicate a year <strong>to</strong> date amount of R2 221.095m<br />
(R180.799m unfavourable variance) <strong>co</strong>mpared <strong>to</strong> a target of R2 040.295m due <strong>to</strong> over<br />
spending during <strong>the</strong> first six months of <strong>the</strong> year.<br />
Outstanding Deb<strong>to</strong>rs report (Annexure B – Table SC3)<br />
The deb<strong>to</strong>rs report has been prepared on <strong>the</strong> basis of <strong>the</strong> <strong>for</strong>mat required <strong>to</strong> be lodged electronically<br />
with National Treasury. This <strong>for</strong>mat provides an extended aged analysis, as well as an aged analysis<br />
by deb<strong>to</strong>r type. The summary report indicates that <strong>the</strong> deb<strong>to</strong>rs >90 days balance as at 31 January<br />
8


