2011/12 Budget Year 2012/13 Description Audited Original Adjusted Monthly actual YearTD actual YearTD budget YTD variance YTD variance Out<strong>co</strong>me Budget Budget R thousands % Full Year Forecast Expenditure - Standard Municipal governance and administration – 1,166,500 – 21,501 381,314 680,419 (299,106) -43.96% 1,166,500 Executive and <strong>co</strong>uncil – 236,363 – 17,018 115,045 137,870 (22,826) -16.56% 236,363 Mayor and Council 226,841 16,507 110,846 132,316 (21,470) -16.23% 226,841 Municipal Manager 9,522 511 4,198 5,554 (1,356) -24.41% 9,522 Budget and treasury office 662,142 (2,067) 129,681 386,227 (256,547) -66.42% 662,142 Corporate services – 267,995 – 6,550 136,588 156,322 (19,733) -12.62% 267,995 Human Resources 39,539 3,380 21,856 23,063 (1,207) -5.23% 39,539 <strong>In</strong><strong>for</strong>mation Technology 74,923 3,537 30,997 43,703 (12,706) -29.07% 74,923 Property Services 64,443 (5,679) 16,312 37,590 (21,278) -56.61% 64,443 O<strong>the</strong>r Admin 89,090 5,313 67,424 51,966 15,458 29.75% 89,090 Community and public safety – 317,651 – 15,439 159,138 185,286 (26,148) -14.11% 317,651 Community and social services – 98,899 – 5,626 46,819 57,688 (10,869) -18.84% 98,899 Libraries and Archives 17,698 1,015 8,648 10,323 (1,676) -16.23% 17,698 Museums & Art Galleries etc 1,532 117 789 893 (104) -11.66% 1,532 Community halls and Facilities – – – – – – Cemeteries & Crema<strong>to</strong>riums 15,662 391 6,712 9,136 (2,424) -26.53% 15,662 Child Care – – – – – – Aged Care – – – – – – O<strong>the</strong>r Community – – – – – – O<strong>the</strong>r Social 64,007 4,104 30,671 37,335 (6,665) -17.85% 64,007 Sport and recreation 4,439 (25) 1,354 2,589 (1,235) -47.69% 4,439 Public safety – 168,163 – 7,211 86,400 98,089 (11,689) -11.92% 168,163 Police 103,171 2,738 52,224 60,180 (7,955) -13.22% 103,171 Fire 50,750 3,509 28,933 29,602 (670) -2.26% 50,750 Civil Defence – – – – – Street Lighting 10,699 729 3,724 6,241 (2,517) -40.33% 10,699 O<strong>the</strong>r 3,543 233 1,520 2,067 (547) -26.46% 3,543 Housing 36,165 1,910 19,298 21,095 (1,798) -8.52% 36,165 Health – 9,985 – 716 5,266 5,824 (558) -9.59% 9,985 Clinics – – – – – – Ambulance – – – – – – O<strong>the</strong>r 9,985 716 5,266 5,824 (558) -9.59% 9,985 E<strong>co</strong>nomic and environmental services – 279,065 – 448 76,145 162,778 (86,634) -53.22% 279,065 Planning and development – 77,737 – 2,704 22,381 45,344 (22,963) -50.64% 77,737 E<strong>co</strong>nomic Development/Planning 25,231 942 7,679 14,717 (7,039) -47.83% 25,231 Town Planning/Building en<strong>for</strong>cement 52,506 1,762 14,702 30,627 (15,925) -52.00% 52,506 Licensing & Regulation – – – – – – Road transport – 185,093 – (3,380) 45,795 107,965 (62,170) -57.58% 185,093 Roads 183,673 (3,464) 45,018 107,137 (62,119) -57.98% 183,673 Public Buses – – – – – – Parking Garages 1,420 84 777 828 (51) -6.14% 1,420 Vehicle Licensing and Testing – – – – – – O<strong>the</strong>r – – – – – – Environmental protection – 16,234 – 1,124 7,968 9,469 (1,501) -15.85% 16,234 Pollution Control – – – – – – Biodiversity & Landscape – – – – – – O<strong>the</strong>r 16,234 1,124 7,968 9,469 (1,501) -15.85% 16,234 Trading services – 2,398,893 – 137,282 1,163,502 1,399,274 (235,772) -16.85% 2,398,893 Electricity – 1,656,949 – 92,718 787,577 966,498 (178,922) -18.51% 1,656,949 Electricity Distribution 1,649,546 92,043 783,588 962,180 (178,592) -18.56% 1,649,546 Electricity Generation 7,403 674 3,988 4,318 (330) -7.63% 7,403 Water – 518,065 – 38,793 274,664 302,187 (27,524) -9.11% 518,065 Water Distribution 518,065 38,793 274,664 302,187 (27,524) -9.11% 518,065 Water S<strong>to</strong>rage – – – – – Waste water management – 116,246 – (2,165) 48,625 67,806 (19,181) -28.29% 116,246 Sewerage 116,246 (2,165) 48,625 67,806 (19,181) -28.29% 116,246 S<strong>to</strong>rm Water Management – – – – – Public Toilets – – – – – Waste management – 107,633 – 7,936 52,637 62,782 (10,146) -16.16% 107,633 Solid Waste 107,633 7,936 52,637 62,782 (10,146) -16.16% 107,633 O<strong>the</strong>r – 14,206 – 319 6,022 8,287 (2,265) -27.33% 14,206 Air Transport 345 61 79 201 (123) -60.97% 345 Abat<strong>to</strong>irs – – – – – – Tourism – – – – – – Forestry – – – – – – Markets 13,861 258 5,943 8,085 (2,142) -26.50% 13,861 Total Expenditure - Standard – 4,176,315 – 174,988 1,786,119 2,436,044 (649,925) -26.68% 4,176,315 Surplus/ (Deficit) <strong>for</strong> <strong>the</strong> year – 712,001 – 107,976 842,845 415,310 427,535 102.94% 712,001 20
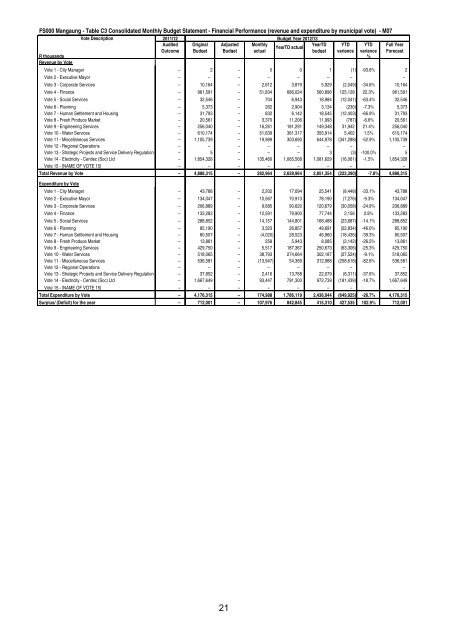
FS000 <strong>Mangaung</strong> - Table C3 Consolidated Monthly Budget Statement - Financial Per<strong>for</strong>mance (revenue and expenditure by municipal vote) - M07 Vote Description 2011/12 Budget Year 2012/13 Audited Original Adjusted Monthly YearTD YTD YTD Full Year YearTD actual Out<strong>co</strong>me Budget Budget actual budget variance variance Forecast R thousands % Revenue by Vote Vote 1 - City Manager – 2 – 0 0 1 (1) -93.6% 2 Vote 2 - Executive Mayor – – – – – – – – Vote 3 - Corporate Services – 10,164 – 2,612 3,879 5,929 (2,049) -34.6% 10,164 Vote 4 - Finance – 961,591 – 51,834 686,024 560,896 125,128 22.3% 961,591 Vote 5 - Social Services – 32,546 – 704 6,943 18,984 (12,041) -63.4% 32,546 Vote 6 - Planning – 5,373 – 262 2,904 3,134 (230) -7.3% 5,373 Vote 7 - Human Settlement and Housing – 31,793 – 832 6,142 18,545 (12,403) -66.9% 31,793 Vote 8 - Fresh Produce Market – 20,561 – 3,370 11,206 11,993 (787) -6.6% 20,561 Vote 9 - Engineering Services – 256,040 – 16,261 181,291 149,348 31,942 21.4% 256,040 Vote 10 - Water Services – 610,174 – 51,639 361,317 355,914 5,402 1.5% 610,174 Vote 11 - Miscellaneous Services – 1,105,739 – 19,989 303,690 644,978 (341,288) -52.9% 1,105,739 Vote 12 - Regional Operations – – – – – – – – Vote 13 - Strategic Projects and Service Delivery Regulation – 5 – – – 3 (3) -100.0% 5 Vote 14 - Electricity - Centlec (Soc) Ltd – 1,854,328 – 135,460 1,065,568 1,081,629 (16,061) -1.5% 1,854,328 Vote 15 - [NAME OF VOTE 15] – – – – – – – – Total Revenue by Vote – 4,888,315 – 282,964 2,628,964 2,851,354 (222,390) -7.8% 4,888,315 Expenditure by Vote Vote 1 - City Manager – 43,788 – 2,202 17,094 25,541 (8,448) -33.1% 43,788 Vote 2 - Executive Mayor – 134,047 – 10,567 70,913 78,190 (7,276) -9.3% 134,047 Vote 3 - Corporate Services – 206,889 – 9,685 90,620 120,679 (30,058) -24.9% 206,889 Vote 4 - Finance – 133,283 – 12,591 79,900 77,744 2,156 2.8% 133,283 Vote 5 - Social Services – 288,852 – 14,157 144,801 168,488 (23,687) -14.1% 288,852 Vote 6 - Planning – 85,190 – 3,323 26,857 49,691 (22,834) -46.0% 85,190 Vote 7 - Human Settlement and Housing – 80,507 – (4,020) 28,523 46,960 (18,436) -39.3% 80,507 Vote 8 - Fresh Produce Market – 13,861 – 258 5,943 8,085 (2,142) -26.5% 13,861 Vote 9 - Engineering Services – 429,750 – 5,517 187,367 250,673 (63,306) -25.3% 429,750 Vote 10 - Water Services – 518,065 – 38,793 274,664 302,187 (27,524) -9.1% 518,065 Vote 11 - Miscellaneous Services – 536,581 – (13,947) 54,369 312,988 (258,618) -82.6% 536,581 Vote 12 - Regional Operations – – – – – – – – Vote 13 - Strategic Projects and Service Delivery Regulation – 37,852 – 2,416 13,768 22,079 (8,311) -37.6% 37,852 Vote 14 - Electricity - Centlec (Soc) Ltd – 1,667,649 – 93,447 791,300 972,739 (181,439) -18.7% 1,667,649 Vote 15 - [NAME OF VOTE 15] – – – – – – – – Total Expenditure by Vote – 4,176,315 – 174,988 1,786,119 2,436,044 (649,925) -26.7% 4,176,315 Surplus/ (Deficit) <strong>for</strong> <strong>the</strong> year – 712,001 – 107,976 842,845 415,310 427,535 102.9% 712,001 21