

to download the PDF for MFMA Mangaung In ... - Mangaung.co.za
to download the PDF for MFMA Mangaung In ... - Mangaung.co.za
to download the PDF for MFMA Mangaung In ... - Mangaung.co.za

You also want an ePaper? Increase the reach of your titles
YUMPU automatically turns print PDFs into web optimized ePapers that Google loves.
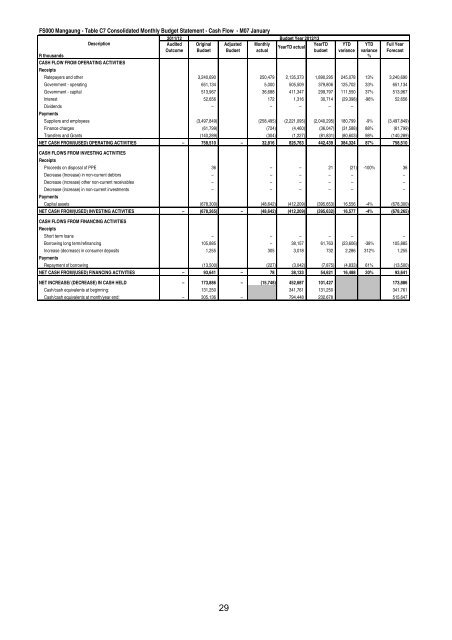
FS000 <strong>Mangaung</strong> - Table C7 Consolidated Monthly Budget Statement - Cash Flow - M07 January<br />
2011/12 Budget Year 2012/13<br />
Description<br />
Audited Original Adjusted Monthly<br />
YearTD YTD YTD Full Year<br />
YearTD actual<br />
Out<strong>co</strong>me Budget Budget actual<br />
budget variance variance Forecast<br />
R thousands %<br />
CASH FLOW FROM OPERATING ACTIVITIES<br />
Receipts<br />
Ratepayers and o<strong>the</strong>r 3,240,690 250,479 2,135,373 1,890,295 245,078 13% 3,240,690<br />
Government - operating 651,134 5,000 505,509 379,806 125,702 33% 651,134<br />
Government - capital 513,967 36,688 411,347 299,797 111,550 37% 513,967<br />
<strong>In</strong>terest 52,656 172 1,316 30,714 (29,398) -96% 52,656<br />
Dividends – – – – –<br />
Payments<br />
Suppliers and employees (3,497,849) (258,495) (2,221,095) (2,040,295) 180,799 -9% (3,497,849)<br />
Finance charges (61,799) (724) (4,460) (36,047) (31,588) 88% (61,799)<br />
Transfers and Grants (140,289) (304) (1,227) (81,831) (80,603) 98% (140,289)<br />
NET CASH FROM/(USED) OPERATING ACTIVITIES – 758,510 – 32,816 826,763 442,439 384,324 87% 758,510<br />
CASH FLOWS FROM INVESTING ACTIVITIES<br />
Receipts<br />
Proceeds on disposal of PPE 36 – – 21 (21) -100% 36<br />
Decrease (<strong>In</strong>crease) in non-current deb<strong>to</strong>rs – – – – – –<br />
Decrease (increase) o<strong>the</strong>r non-current receivables – – – – – –<br />
Decrease (increase) in non-current investments – – – – – –<br />
Payments<br />
Capital assets (678,300) (48,642) (412,209) (395,653) 16,556 -4% (678,300)<br />
NET CASH FROM/(USED) INVESTING ACTIVITIES – (678,265) – (48,642) (412,209) (395,632) 16,577 -4% (678,265)<br />
CASH FLOWS FROM FINANCING ACTIVITIES<br />
Receipts<br />
Short term loans – – – – – –<br />
Borrowing long term/refinancing 105,885 – 38,157 61,763 (23,606) -38% 105,885<br />
<strong>In</strong>crease (decrease) in <strong>co</strong>nsumer deposits 1,255 305 3,018 732 2,286 312% 1,255<br />
Payments<br />
Repayment of borrowing (13,500) (227) (3,042) (7,875) (4,833) 61% (13,500)<br />
NET CASH FROM/(USED) FINANCING ACTIVITIES – 93,641 – 78 38,133 54,621 16,488 30% 93,641<br />
NET INCREASE/ (DECREASE) IN CASH HELD – 173,886 – (15,748) 452,687 101,427 173,886<br />
Cash/cash equivalents at beginning: 131,250 341,761 131,250 341,761<br />
Cash/cash equivalents at month/year end: – 305,136 – 794,448 232,678 515,647<br />
29


