Accu-Chek Smart Pix - ACCU-CHEK Insulin Pumps
Accu-Chek Smart Pix - ACCU-CHEK Insulin Pumps
Accu-Chek Smart Pix - ACCU-CHEK Insulin Pumps

You also want an ePaper? Increase the reach of your titles
YUMPU automatically turns print PDFs into web optimized ePapers that Google loves.
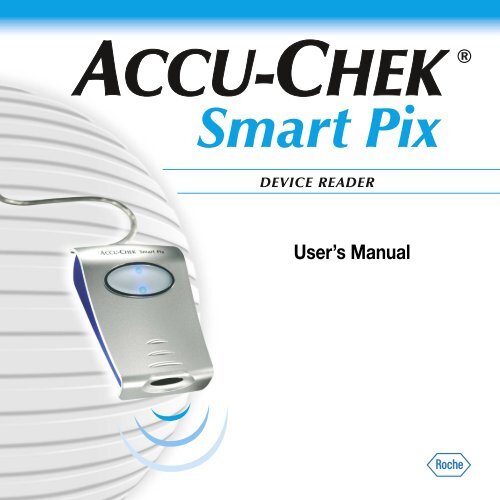
<strong>Smart</strong> <strong>Pix</strong><br />
DEVICE READER<br />
User’s Manual
<strong>Accu</strong>-<strong>Chek</strong> <strong>Smart</strong> <strong>Pix</strong> User’s Manual<br />
Date of issue: April 2009<br />
© 2009, Roche Diagnostics GmbH<br />
All rights reserved<br />
<strong>ACCU</strong>-<strong>CHEK</strong>, <strong>ACCU</strong>-<strong>CHEK</strong> AVIVA, <strong>ACCU</strong>-<strong>CHEK</strong> AVIVA COMBO, <strong>ACCU</strong>-<strong>CHEK</strong> AVIVA NANO,<br />
<strong>ACCU</strong>-<strong>CHEK</strong> AVIVA EXPERT, <strong>ACCU</strong>-<strong>CHEK</strong> GO, <strong>ACCU</strong>-<strong>CHEK</strong> INTEGRA, <strong>ACCU</strong>-<strong>CHEK</strong> MOBILE,<br />
<strong>ACCU</strong>-<strong>CHEK</strong> PERFORMA, <strong>ACCU</strong>-<strong>CHEK</strong> SPIRIT, <strong>ACCU</strong>-<strong>CHEK</strong> SPIRIT COMBO, <strong>ACCU</strong>-<strong>CHEK</strong> SMART PIX,<br />
ADVANTAGE, CAMIT, COMBO, DISETRONIC, D-TRONPLUS, PERFORMA COMBO, PERFORMA EXPERT,<br />
PERFORMA NANO, VOICEMATE and LIVE LIFE. THE WAY YOU WANT. are trademarks of Roche.<br />
Other brand or product names are trademarks of their respective holders.<br />
Product safety information<br />
This device is designed according to the International Standard IEC 60950 “Safety of Information Technology<br />
Equipment” and it was in perfectly safe condition when it left the factory.<br />
This product meets the requirements of EU Council Directive 2004/108/EC of December 15, 2004 on the<br />
approximation of the laws of the Member States relating to electromagnetic compatibility. Conformity with the<br />
aforementioned directive is certified by the CE mark on the device.<br />
The device may only be operated via the USB port of a suitable computer.<br />
The <strong>Accu</strong>-<strong>Chek</strong> <strong>Smart</strong> <strong>Pix</strong> system is installed, used and maintained by the user and is the user's sole<br />
responsibility.
<strong>Accu</strong>-<strong>Chek</strong> <strong>Smart</strong> <strong>Pix</strong><br />
Contents<br />
Version note ................................................................................................................................................................................I-4<br />
1 <strong>Accu</strong>-<strong>Chek</strong> <strong>Smart</strong> <strong>Pix</strong> System overview.................................................................................................................1-1<br />
1.1 Printed symbols .........................................................................................................................................................................1-3<br />
1.2 Overview of the <strong>Accu</strong>-<strong>Chek</strong> <strong>Smart</strong> <strong>Pix</strong> system ..............................................................................................................1-4<br />
1.3 Overview of the <strong>Accu</strong>-<strong>Chek</strong> <strong>Smart</strong> <strong>Pix</strong> status indicator signals ..............................................................................1-5<br />
1.4 Overview of the <strong>Accu</strong>-<strong>Chek</strong> <strong>Smart</strong> <strong>Pix</strong> user interface ................................................................................................1-6<br />
2 Installing the <strong>Accu</strong>-<strong>Chek</strong> <strong>Smart</strong> <strong>Pix</strong> system.......................................................................................................2-1<br />
2.1 What you require for using the <strong>Accu</strong>-<strong>Chek</strong> <strong>Smart</strong> <strong>Pix</strong> system ................................................................................2-1<br />
2.2 Connecting the <strong>Accu</strong>-<strong>Chek</strong> <strong>Smart</strong> <strong>Pix</strong> device ................................................................................................................2-2<br />
Note about security settings in the Internet browser .................................................................................................2-3<br />
2.3 Final preparations .....................................................................................................................................................................2-4<br />
2.4 Configuring the <strong>Accu</strong>-<strong>Chek</strong> <strong>Smart</strong> <strong>Pix</strong> system ..............................................................................................................2-5<br />
Selecting a language ...............................................................................................................................................................2-7<br />
Display options ..........................................................................................................................................................................2-8<br />
Personal Setup ...........................................................................................................................................................................2-9<br />
Report Setup ........................................................................................................................................................................... 2-11<br />
Completing configuration ................................................................................................................................................... 2-14<br />
3 Preparing the devices ..............................................................................................................................................................3-1<br />
3.1 <strong>Accu</strong>-<strong>Chek</strong> Active ....................................................................................................................................................................3-4<br />
3.2 <strong>Accu</strong>-<strong>Chek</strong> Aviva/Aviva Nano .............................................................................................................................................3-5<br />
3.3 <strong>Accu</strong>-<strong>Chek</strong> Aviva Combo/Aviva Expert ............................................................................................................................3-6<br />
3.4 <strong>Accu</strong>-<strong>Chek</strong> Compact/Integra ...............................................................................................................................................3-7<br />
3.5 <strong>Accu</strong>-<strong>Chek</strong> Compact Plus .....................................................................................................................................................3-8<br />
3.6 <strong>Accu</strong>-<strong>Chek</strong> Go ...........................................................................................................................................................................3-9<br />
3.7 <strong>Accu</strong>-<strong>Chek</strong> Mobile ................................................................................................................................................................ 3-10<br />
3.8 <strong>Accu</strong>-<strong>Chek</strong> Sensor/Advantage ......................................................................................................................................... 3-11<br />
3.9 <strong>Accu</strong>-<strong>Chek</strong> Comfort .............................................................................................................................................................. 3-12<br />
3.10 <strong>Accu</strong>-<strong>Chek</strong> Performa/Performa Nano ........................................................................................................................... 3-13<br />
3.11 <strong>Accu</strong>-<strong>Chek</strong> Performa Combo/Performa Expert .......................................................................................................... 3-14<br />
3.12 <strong>Accu</strong>-<strong>Chek</strong> Pocket Compass software .......................................................................................................................... 3-15<br />
3.13 <strong>Accu</strong>-<strong>Chek</strong> Voicemate Plus ............................................................................................................................................... 3-16<br />
3.14 <strong>Insulin</strong> pump <strong>Accu</strong>-<strong>Chek</strong> D-TRONplus (and Disetronic D-TRONplus) ............................................................ 3-17<br />
3.15 <strong>Accu</strong>-<strong>Chek</strong> Spirit insulin pump ........................................................................................................................................ 3-18<br />
3.16 <strong>Accu</strong>-<strong>Chek</strong> Spirit Combo insulin pump ........................................................................................................................ 3-19<br />
3.17 Note on time settings for the <strong>Accu</strong>-<strong>Chek</strong> insulin pumps ....................................................................................... 3-20<br />
<strong>Accu</strong>-<strong>Chek</strong> <strong>Smart</strong> <strong>Pix</strong> user's manual I-1
<strong>Accu</strong>-<strong>Chek</strong> <strong>Smart</strong> <strong>Pix</strong><br />
Contents<br />
4 <strong>Accu</strong>-<strong>Chek</strong> Report ...................................................................................................................................................................... 4-1<br />
4.1 Printing reports ......................................................................................................................................................................... 4-2<br />
4.2 Blood glucose: general information about the reports .............................................................................................. 4-3<br />
Types of report .......................................................................................................................................................................... 4-3<br />
Evaluated data ........................................................................................................................................................................... 4-4<br />
Report Styles............................................................................................................................................................................... 4-5<br />
Graphic elements of the reports ........................................................................................................................................ 4-6<br />
4.3 Blood glucose: content of the report ..............................................................................................................................4-10<br />
Trend Graph .............................................................................................................................................................................4-10<br />
Day Graph .................................................................................................................................................................................4-12<br />
Week Graph .............................................................................................................................................................................4-14<br />
Metabolic Control ..................................................................................................................................................................4-16<br />
Distribution ...............................................................................................................................................................................4-18<br />
Logbook .....................................................................................................................................................................................4-19<br />
Overview ....................................................................................................................................................................................4-21<br />
Record List ...............................................................................................................................................................................4-23<br />
4.4 <strong>Insulin</strong> pump: general information about the reports ..............................................................................................4-24<br />
Types of report ........................................................................................................................................................................4-24<br />
Graphic elements of the reports ......................................................................................................................................4-25<br />
4.5 <strong>Insulin</strong> pump: content of the report ................................................................................................................................4-27<br />
Trend Graph .............................................................................................................................................................................4-27<br />
Day Graph .................................................................................................................................................................................4-28<br />
Week Graph .............................................................................................................................................................................4-28<br />
Basal Rates ...............................................................................................................................................................................4-29<br />
Basal Bolus ...............................................................................................................................................................................4-30<br />
Long Term Overview .............................................................................................................................................................4-31<br />
Lists .............................................................................................................................................................................................4-32<br />
4.6 Blood glucose and insulin pump: combined report ..................................................................................................4-33<br />
Types of report ........................................................................................................................................................................4-34<br />
Graphic elements of the reports ......................................................................................................................................4-34<br />
Trend Graph .............................................................................................................................................................................4-35<br />
Day Graph .................................................................................................................................................................................4-35<br />
Week Graph .............................................................................................................................................................................4-36<br />
Overview ....................................................................................................................................................................................4-36<br />
Record List ...............................................................................................................................................................................4-40<br />
4.7 Analysing data in external applications ........................................................................................................................4-41<br />
4.8 Literary references for reports ..........................................................................................................................................4-43<br />
Low/High BG Index ...............................................................................................................................................................4-43<br />
I-2 <strong>Accu</strong>-<strong>Chek</strong> <strong>Smart</strong> <strong>Pix</strong> user's manual
<strong>Accu</strong>-<strong>Chek</strong> <strong>Smart</strong> <strong>Pix</strong><br />
Contents<br />
5 Error signals and troubleshooting................................................................................................................................5-1<br />
5.1 Errors without error signals ..................................................................................................................................................5-1<br />
5.2 Error signals on the device ...................................................................................................................................................5-2<br />
6 Maintenance .....................................................................................................................................................................................6-1<br />
6.1 Cleaning the <strong>Accu</strong>-<strong>Chek</strong> <strong>Smart</strong> <strong>Pix</strong> system ....................................................................................................................6-1<br />
6.2 Disposal ........................................................................................................................................................................................6-1<br />
7 Appendix ...............................................................................................................................................................................................7-1<br />
7.1 Abbreviations .............................................................................................................................................................................7-1<br />
7.2 Technical data ...........................................................................................................................................................................7-1<br />
7.3 Information about advice and the repair service ..........................................................................................................7-2<br />
7.4 Roche Diagnostics addresses ..............................................................................................................................................7-3<br />
<strong>Accu</strong>-<strong>Chek</strong> <strong>Smart</strong> <strong>Pix</strong> user's manual I-3
Version note<br />
Version note<br />
This user’s manual applies to software version 3.0 of the<br />
<strong>Accu</strong>-<strong>Chek</strong> <strong>Smart</strong> <strong>Pix</strong> system. You can check the software<br />
version of your <strong>Accu</strong>-<strong>Chek</strong> <strong>Smart</strong> <strong>Pix</strong> system on the user<br />
interface (browser window) at any time. The version number<br />
is shown in the left corner of the menu bar.<br />
For the latest software version of the <strong>Accu</strong>-<strong>Chek</strong> <strong>Smart</strong> <strong>Pix</strong><br />
system (as an installable update), contact your local Roche<br />
Diagnostics office.<br />
I-4 <strong>Accu</strong>-<strong>Chek</strong> <strong>Smart</strong> <strong>Pix</strong> user's manual
Chapter 1, <strong>Accu</strong>-<strong>Chek</strong> <strong>Smart</strong> <strong>Pix</strong> System overview<br />
1 <strong>Accu</strong>-<strong>Chek</strong> <strong>Smart</strong> <strong>Pix</strong> System overview<br />
The <strong>Accu</strong>-<strong>Chek</strong> <strong>Smart</strong> <strong>Pix</strong> system is used to easily and<br />
automatically analyse blood glucose levels and therapy data<br />
from various <strong>Accu</strong>-<strong>Chek</strong> meters and insulin pumps. The<br />
analyses are displayed on a computer in the form of various,<br />
specifiable reports using a standard Internet browser. As a<br />
result the reports can also be printed on a connected printer.<br />
In many clinics and doctors' practices, such reports are used<br />
successfully (often together with the software products<br />
<strong>Accu</strong>-<strong>Chek</strong> Camit Pro or <strong>Accu</strong>-<strong>Chek</strong> Compass) to facilitate<br />
and speed up assessment of the metabolic situation. The<br />
<strong>Accu</strong>-<strong>Chek</strong> <strong>Smart</strong> <strong>Pix</strong> system features similar functionality.<br />
However, operator control is reduced to a simple activity<br />
which has since become everyday routine: just a few mouse<br />
clicks on a computer are sufficient to see the finished report<br />
on the monitor or get a hardcopy of it.<br />
<strong>Accu</strong>-<strong>Chek</strong> <strong>Smart</strong> <strong>Pix</strong> user's manual 1-1
Chapter 1, <strong>Accu</strong>-<strong>Chek</strong> <strong>Smart</strong> <strong>Pix</strong> System overview<br />
The procedure is as simple as it could possibly be:<br />
• Prepare the meter for data transfer<br />
• Place the meter in front of the <strong>Accu</strong>-<strong>Chek</strong> <strong>Smart</strong> <strong>Pix</strong><br />
device<br />
• The report is created automatically and can be viewed<br />
and printed on a computer using an Internet browser<br />
On the following pages, you will find more detailed<br />
information about the various components, their application<br />
and the content of the reports compiled with the <strong>Accu</strong>-<strong>Chek</strong><br />
<strong>Smart</strong> <strong>Pix</strong> system.<br />
Please read all these pages carefully. To be able to use your<br />
new system successfully, you should know everything that is<br />
explained here. If you have any additional questions, you will<br />
find some helpful information in the appendix, along with<br />
addresses of offices to contact in order to get the answers<br />
you require.<br />
1-2 <strong>Accu</strong>-<strong>Chek</strong> <strong>Smart</strong> <strong>Pix</strong> user's manual
Chapter 1, <strong>Accu</strong>-<strong>Chek</strong> <strong>Smart</strong> <strong>Pix</strong> System overview<br />
1.1 Printed symbols<br />
Some passages in this manual are highlighted by symbols.<br />
Please read these passages very carefully! There are more<br />
symbols on the type plate of the device and/or the<br />
packaging.<br />
Symbol Name Description<br />
Warning On the type plate: Refer to accompanying documents.<br />
Please refer to safety-related notes in the manual<br />
accompanying this instrument.<br />
Warning In the user’s manual: Indicates important health or safety<br />
information.<br />
This symbol draws attention to important information.<br />
i<br />
Manufacturer<br />
REF<br />
SN<br />
Catalogue number<br />
Serial number<br />
This product fulfils the requirements of EC Directive<br />
2004/108/EC.<br />
This product fulfils the legal requirements of the People’s<br />
Republic of China on the use of certain substances in<br />
electronic products.<br />
US patent pending (US 2007/0055799)<br />
<strong>Accu</strong>-<strong>Chek</strong> <strong>Smart</strong> <strong>Pix</strong> user's manual 1-3
Chapter 1, <strong>Accu</strong>-<strong>Chek</strong> <strong>Smart</strong> <strong>Pix</strong> System overview<br />
1.2 Overview of the <strong>Accu</strong>-<strong>Chek</strong> <strong>Smart</strong> <strong>Pix</strong> system<br />
2<br />
1<br />
3<br />
4<br />
5<br />
The system consists of the following components, which are<br />
described in brief below.<br />
1 <strong>Accu</strong>-<strong>Chek</strong> <strong>Smart</strong> <strong>Pix</strong> Device: The central component<br />
of the system. This device is the interface to various<br />
<strong>Accu</strong>-<strong>Chek</strong> meters and insulin pumps, and it<br />
contains the electronics as well as the programs to<br />
process the data and results which are read in. The<br />
analyses created are temporarily stored in the device<br />
and can be viewed with an Internet browser.<br />
2 USB connector for hooking up to the computer.<br />
3 Status indicator, showing operating status.<br />
(see page 1-5).<br />
4 Infrared window for communication with<br />
<strong>Accu</strong>-<strong>Chek</strong> meters and insulin pumps.<br />
5 On the back of the device, there is a holder for an<br />
<strong>Accu</strong>-<strong>Chek</strong> IR Key. This accessory can be safely<br />
stored here to save space when it is not required. The<br />
<strong>Accu</strong>-<strong>Chek</strong> IR Key allows infrared data transfer with<br />
<strong>Accu</strong>-<strong>Chek</strong> meters which do not have a built-in<br />
infrared port (<strong>Accu</strong>-<strong>Chek</strong> Sensor and <strong>Accu</strong>-<strong>Chek</strong><br />
Comfort). In the devices indicated, it is used for data<br />
transfer in place of the code chip.<br />
The <strong>Accu</strong>-<strong>Chek</strong> IR Key is available as an accessory<br />
(REF 0 3307778190) if you have not already received<br />
it from your dealer or Roche Diagnostics.<br />
Not illustrated:<br />
6 User’s manual (this document)<br />
1-4 <strong>Accu</strong>-<strong>Chek</strong> <strong>Smart</strong> <strong>Pix</strong> user's manual
Chapter 1, <strong>Accu</strong>-<strong>Chek</strong> <strong>Smart</strong> <strong>Pix</strong> System overview<br />
1.3 Overview of the <strong>Accu</strong>-<strong>Chek</strong> <strong>Smart</strong> <strong>Pix</strong> status indicator signals<br />
7<br />
The <strong>Accu</strong>-<strong>Chek</strong> <strong>Smart</strong> <strong>Pix</strong> system indicates various operating<br />
states on the status indicator on top of the device. The<br />
following signals can appear on this indicator:<br />
7 Off:<br />
The <strong>Accu</strong>-<strong>Chek</strong> <strong>Smart</strong> <strong>Pix</strong> device is not connected to<br />
a computer, or the computer is not switched on.<br />
8<br />
9<br />
8 Centre of status indicator<br />
• Lit continuously: report is ready on the computer,<br />
idle state.<br />
• Flashing slowly: error<br />
9 Top/bottom dots<br />
• Flashing simultaneously about once a second: device<br />
is ready for operation and is actively searching for<br />
meters or insulin pumps.<br />
• Flashing fast simultaneously: data transfer<br />
10 Left/right dots<br />
• Flashing slowly simultaneously: processing report<br />
data<br />
10<br />
Software updates for the <strong>Accu</strong>-<strong>Chek</strong> <strong>Smart</strong> <strong>Pix</strong><br />
system can be installed via the computer. While such<br />
an update is being installed, the centre of the status<br />
indicator 8 and (simultaneaously) the dots 9 and 10<br />
flash alternately.<br />
<strong>Accu</strong>-<strong>Chek</strong> <strong>Smart</strong> <strong>Pix</strong> user's manual 1-5
Chapter 1, <strong>Accu</strong>-<strong>Chek</strong> <strong>Smart</strong> <strong>Pix</strong> System overview<br />
1.4 Overview of the <strong>Accu</strong>-<strong>Chek</strong> <strong>Smart</strong> <strong>Pix</strong> user interface<br />
11<br />
12<br />
The <strong>Accu</strong>-<strong>Chek</strong> <strong>Smart</strong> <strong>Pix</strong> system has a user interface which<br />
is displayed in standard Internet browsers. You do not<br />
require an Internet connection if you wish to use the<br />
<strong>Accu</strong>-<strong>Chek</strong> <strong>Smart</strong> <strong>Pix</strong> system. The relevant pages are stored<br />
in the device itself where they can be called up. The user<br />
interface is optimised for a screen resolution of at least<br />
1024 x 768 pixels.<br />
11 Internet browser (Microsoft Internet Explorer, Firefox)<br />
12 Buttons for calling up various functions (contextdependent):<br />
• Settings<br />
• Create Report (Print)<br />
• Erase Report<br />
• Read device<br />
13 14<br />
13 Navigation bar for calling up the individual pages<br />
(reports and settings), which are then shown in the<br />
display pane 14<br />
14 Display pane for reports and settings<br />
i<br />
Even if various functions are available to you in the<br />
Internet browser itself (e.g. Navigate forward/back,<br />
Refresh, Print, etc.), we advise you to only use the<br />
relevant functions on the <strong>Accu</strong>-<strong>Chek</strong> <strong>Smart</strong> <strong>Pix</strong> user<br />
interface instead. The <strong>Accu</strong>-<strong>Chek</strong> <strong>Smart</strong> <strong>Pix</strong> system<br />
provides several options for customising printouts, for<br />
example. These options will not be available to you if<br />
you use the standard functions of the browser.<br />
For a detailed description of the various elements, see<br />
Chapter 2.4, “Configuring the <strong>Accu</strong>-<strong>Chek</strong> <strong>Smart</strong> <strong>Pix</strong> system”<br />
and Chapter 4, “<strong>Accu</strong>-<strong>Chek</strong> Report”.<br />
1-6 <strong>Accu</strong>-<strong>Chek</strong> <strong>Smart</strong> <strong>Pix</strong> user's manual
Chapter 2, Installing the <strong>Accu</strong>-<strong>Chek</strong> <strong>Smart</strong> <strong>Pix</strong> system<br />
2 Installing the <strong>Accu</strong>-<strong>Chek</strong> <strong>Smart</strong> <strong>Pix</strong> system<br />
2.1 What you require for using the <strong>Accu</strong>-<strong>Chek</strong> <strong>Smart</strong> <strong>Pix</strong> system<br />
You can connect the <strong>Accu</strong>-<strong>Chek</strong> <strong>Smart</strong> <strong>Pix</strong> system to any<br />
computer which meets the necessary system requirements<br />
(see below). No further steps are necessary to prepare the<br />
device for operation. Nor is it necessary to install any<br />
additional software. However, before the device is used for<br />
the first time you should configure it with your personal<br />
diabetes-related data according to your requirements in<br />
order to obtain customised, accurate reports.<br />
The following components are supplied:<br />
• <strong>Accu</strong>-<strong>Chek</strong> <strong>Smart</strong> <strong>Pix</strong> Device with USB connector<br />
• Manual on CD-ROM<br />
• Getting Started Guide<br />
• Carrying bag for storing the <strong>Accu</strong>-<strong>Chek</strong> <strong>Smart</strong> <strong>Pix</strong><br />
device<br />
In addition, you require:<br />
• A PC with a free USB port<br />
• Operating system Microsoft Windows 2000 (Service<br />
Pack 4), XP or Vista (older systems do not provide<br />
integrated USB support)<br />
• An installed Internet browser (e.g. Microsoft Internet<br />
Explorer 5.x and later or Firefox 1.x and later)<br />
• Since the user interface of the <strong>Accu</strong>-<strong>Chek</strong> <strong>Smart</strong> <strong>Pix</strong><br />
system is optimised for a screen resolution of<br />
1024 x 768 pixels, you should use a monitor which<br />
is set to that resolution (or higher).<br />
• If you wish to print out the reports, you also require<br />
a printer which is connected to the PC.<br />
<strong>Accu</strong>-<strong>Chek</strong> <strong>Smart</strong> <strong>Pix</strong> user's manual 2-1
Chapter 2, Installing the <strong>Accu</strong>-<strong>Chek</strong> <strong>Smart</strong> <strong>Pix</strong> system<br />
2.2 Connecting the <strong>Accu</strong>-<strong>Chek</strong> <strong>Smart</strong> <strong>Pix</strong> device<br />
Plug the USB connector of the <strong>Accu</strong>-<strong>Chek</strong> <strong>Smart</strong> <strong>Pix</strong> device<br />
into a free USB socket on your computer. When you do this,<br />
it does not matter whether the computer is switched on or<br />
off. The <strong>Accu</strong>-<strong>Chek</strong> <strong>Smart</strong> <strong>Pix</strong> device is supplied with<br />
electricity via this connection, therefore it does not require<br />
any batteries or power pack.<br />
When you have plugged in the <strong>Accu</strong>-<strong>Chek</strong> <strong>Smart</strong> <strong>Pix</strong> device<br />
and, if necessary, switched on the computer, the centre of<br />
the status indicator and the dots on the left and right are lit.<br />
At the same time, the <strong>Accu</strong>-<strong>Chek</strong> <strong>Smart</strong> <strong>Pix</strong> system is<br />
recognised by the computer as a removable disk (similar to<br />
a USB memory stick). Then the dots at the top and bottom of<br />
the status indicator start flashing slowly. The <strong>Accu</strong>-<strong>Chek</strong><br />
<strong>Smart</strong> <strong>Pix</strong> system is now ready to read data from a device.<br />
2-2 <strong>Accu</strong>-<strong>Chek</strong> <strong>Smart</strong> <strong>Pix</strong> user's manual
Chapter 2, Installing the <strong>Accu</strong>-<strong>Chek</strong> <strong>Smart</strong> <strong>Pix</strong> system<br />
Note about security settings in the Internet browser<br />
The <strong>Accu</strong>-<strong>Chek</strong> <strong>Smart</strong> <strong>Pix</strong> system can use various Internet<br />
browsers to display and print out the meter data. Any<br />
customised settings or settings made when the browser was<br />
installed can have an influence on using the <strong>Accu</strong>-<strong>Chek</strong><br />
<strong>Smart</strong> <strong>Pix</strong> system.<br />
The <strong>Accu</strong>-<strong>Chek</strong> <strong>Smart</strong> <strong>Pix</strong> system uses pages with so-called<br />
“active content” (JavaScript). This active content can be<br />
suppressed by making appropriate security settings in the<br />
browser, causing warnings to be issued or functionality to be<br />
restricted. If this happens, check the relevant browser<br />
settings in order to ensure smooth operation. In many cases,<br />
you can create different security settings for using the<br />
Internet and the <strong>Accu</strong>-<strong>Chek</strong> <strong>Smart</strong> <strong>Pix</strong> system (e.g. at user<br />
log-in to the PC or by defining user profiles in the browser).<br />
If you choose the browser security settings appropriately<br />
(e.g. “Allow active content to run in files on My Computer” or<br />
similar), you can work with the <strong>Accu</strong>-<strong>Chek</strong> <strong>Smart</strong> <strong>Pix</strong> system<br />
without any restrictions.<br />
Note about illustrations in this user’s manual<br />
Please bear in mind that all the illustrations of screen content<br />
(screenshots) used in this user’s manual only serve as<br />
examples in terms of visual appearance and content. Actual<br />
appearance depends on the operating system being used,<br />
the Internet browser being used and any personal system<br />
settings. The content displayed depends not only on your<br />
settings of the <strong>Accu</strong>-<strong>Chek</strong> <strong>Smart</strong> <strong>Pix</strong> system but also on the<br />
meter data or insulin pump data read.<br />
<strong>Accu</strong>-<strong>Chek</strong> <strong>Smart</strong> <strong>Pix</strong> user's manual 2-3
Chapter 2, Installing the <strong>Accu</strong>-<strong>Chek</strong> <strong>Smart</strong> <strong>Pix</strong> system<br />
2.3 Final preparations<br />
The status indicator of the <strong>Accu</strong>-<strong>Chek</strong> <strong>Smart</strong> <strong>Pix</strong> device<br />
starts flashing as soon as the device is connected to a<br />
computer which is switched on. There are several different<br />
status indicator signals which indicate various operating<br />
states (see page 1-5). After plugging in the <strong>Accu</strong>-<strong>Chek</strong><br />
<strong>Smart</strong> <strong>Pix</strong> device or after switching on the computer the<br />
following occurrences indicate that the device is operating<br />
properly:<br />
• The dots at the top and bottom of the status indicator<br />
flash slowly (about once a second). This indicates that<br />
the device is ready for operation and that it is actively<br />
searching for meters and insulin pumps.<br />
• Windows (XP) automatically opens a window showing<br />
the contents of the removable disk (<strong>Smart</strong><strong>Pix</strong>) as a<br />
folder.<br />
• If this does not happen (e.g. in the case of Windows<br />
2000), open the window My Computer with a double<br />
click. You will now see <strong>Smart</strong><strong>Pix</strong> as a removable disk.<br />
• Double-click on <strong>Smart</strong><strong>Pix</strong> (removable disk) in order to<br />
display the contents. You will now see a folder named<br />
REPORT, the START.HTM file and, if applicable, other<br />
files and folders.<br />
If you can follow the above procedure on your computer, the<br />
<strong>Accu</strong>-<strong>Chek</strong> <strong>Smart</strong> <strong>Pix</strong> system is ready to read data from a<br />
meter or an insulin pump. However, you should first perform<br />
the configuration described below in order to customise the<br />
reports properly.<br />
If you have not been able to complete this brief check<br />
successfully (e.g. if the removable disk is not shown), see<br />
Chapter 5 for information about possible sources of error.<br />
2-4 <strong>Accu</strong>-<strong>Chek</strong> <strong>Smart</strong> <strong>Pix</strong> user's manual
Chapter 2, Installing the <strong>Accu</strong>-<strong>Chek</strong> <strong>Smart</strong> <strong>Pix</strong> system<br />
2.4 Configuring the <strong>Accu</strong>-<strong>Chek</strong> <strong>Smart</strong> <strong>Pix</strong> system<br />
The <strong>Accu</strong>-<strong>Chek</strong> <strong>Smart</strong> <strong>Pix</strong> system enables you to customise<br />
the appearance and default parameters (e.g. language,<br />
default setting English) of the reports to suit your<br />
requirements. To perform this configuration (before using the<br />
system for the first time) open the “user interface” of the<br />
<strong>Accu</strong>-<strong>Chek</strong> <strong>Smart</strong> <strong>Pix</strong> system, which is stored in the<br />
START.HTM file on the removable disk.<br />
• Open the START.HTM file with a double click. The<br />
default Internet browser on your computer is launched<br />
and, at the same time, the <strong>Accu</strong>-<strong>Chek</strong> <strong>Smart</strong> <strong>Pix</strong> user<br />
interface is loaded.<br />
• Click (once, as is usual in browsers) on the Settings<br />
button. The <strong>Accu</strong>-<strong>Chek</strong> <strong>Smart</strong> <strong>Pix</strong> device now quits<br />
search mode (the centre of the status indicator is lit<br />
continuously).<br />
You will now see the page showing a Summary of the current<br />
settings (on the right) and the navigation bar with the links to<br />
the various setup areas (on the left). The following setup<br />
options are available<br />
• Language<br />
• Display Options for setting up display formats and year<br />
• Personal Setup for name and time blocks<br />
• Report Setup<br />
The following pages provide detailed descriptions of the<br />
various setup areas. First of all you should set the language<br />
you prefer so that the user interface for all other settings is<br />
displayed in that language.<br />
<strong>Accu</strong>-<strong>Chek</strong> <strong>Smart</strong> <strong>Pix</strong> user's manual 2-5
Chapter 2, Installing the <strong>Accu</strong>-<strong>Chek</strong> <strong>Smart</strong> <strong>Pix</strong> system<br />
Note about saving the settings: The response to saving<br />
the following setting may vary according to the operating<br />
system and browser you are using:<br />
• Changed settings (e.g. Personal Setup) may not<br />
immediately be displayed. In this case, reload the page<br />
(using the appropriate browser button).<br />
• Additional browser windows may open during the<br />
setup process. Simply close them when you have<br />
completed all your settings.<br />
2-6 <strong>Accu</strong>-<strong>Chek</strong> <strong>Smart</strong> <strong>Pix</strong> user's manual
Chapter 2, Installing the <strong>Accu</strong>-<strong>Chek</strong> <strong>Smart</strong> <strong>Pix</strong> system<br />
Selecting a language<br />
On the navigation bar, click on the Language link. The display<br />
pane now shows a drop-down list with all available<br />
languages, the default setting being English. Select the<br />
language which you want to be used both on the browser<br />
screen and for printouts.<br />
• Click on the arrow pointing down to open the<br />
selection list.<br />
• Click on the desired language to select it.<br />
• If you have changed the selection, click the Save<br />
button to send the new selection to the <strong>Accu</strong>-<strong>Chek</strong><br />
<strong>Smart</strong> <strong>Pix</strong> system.<br />
• In the next dialog box, confirm the change to the new<br />
language.<br />
i<br />
If you leave this page (e.g. by clicking on another link<br />
or closing the browser) without saving your selection,<br />
any change you have made will have no effect.<br />
<strong>Accu</strong>-<strong>Chek</strong> <strong>Smart</strong> <strong>Pix</strong> user's manual 2-7
Chapter 2, Installing the <strong>Accu</strong>-<strong>Chek</strong> <strong>Smart</strong> <strong>Pix</strong> system<br />
Display options<br />
On the navigation bar, click on the Display options link. The<br />
display pane now shows the options for the various formats.<br />
Select the following settings here:<br />
• Date and time format.<br />
• Weekend days, usually non-working days. These are<br />
highlighted in some analyses.<br />
• Current year (only for the analysis of data from meters<br />
which do not allow you to set the year).<br />
The selection procedure is identical for all options:<br />
• Click on the arrow pointing down to open the<br />
selection list.<br />
• Click the desired setting to select it.<br />
• When you have completed all your settings on this<br />
page, click the Save button to send the new selection<br />
made to the <strong>Accu</strong>-<strong>Chek</strong> <strong>Smart</strong> <strong>Pix</strong> system.<br />
i<br />
If you leave this page (e.g. by clicking on another link<br />
or closing the browser) without saving your selection,<br />
any change you have made will have no effect.<br />
2-8 <strong>Accu</strong>-<strong>Chek</strong> <strong>Smart</strong> <strong>Pix</strong> user's manual
Chapter 2, Installing the <strong>Accu</strong>-<strong>Chek</strong> <strong>Smart</strong> <strong>Pix</strong> system<br />
Personal Setup<br />
On the navigation bar, click on the Personal Setup link. The<br />
display pane now shows the available options.<br />
• Input fields for personalising the printouts (here you<br />
can enter, for example, the name of a doctor's practice<br />
or pharmacy). This is where you can enter whatever<br />
text you want. The length of each text is limited.<br />
Therefore use abbreviations or another line for your<br />
entries.<br />
• Setting the time ranges. By setting time ranges, you<br />
divide a 24-hour day into eight periods which are<br />
determined by important regular events (e.g. main<br />
meals). For each period, you can specify the start time<br />
while the end time is automatically given with the start<br />
time set for the next period.<br />
The time ranges set here are used in reports to structure<br />
them visually and chronologically in case there is no relevant<br />
information from the meter or insulin pump. The time ranges<br />
can be set in 30-minute increments.<br />
• Click on the arrow pointing up (next to the display on<br />
the right of a start time) in order to set it to a later<br />
time.<br />
• Click on the arrow pointing down (next to the display<br />
on the right of a start time) in order to set it to an<br />
earlier time.<br />
• When you have completed all your settings on this<br />
page, click on the Save button.<br />
<strong>Accu</strong>-<strong>Chek</strong> <strong>Smart</strong> <strong>Pix</strong> user's manual 2-9
Chapter 2, Installing the <strong>Accu</strong>-<strong>Chek</strong> <strong>Smart</strong> <strong>Pix</strong> system<br />
i<br />
These settings, unlike any other settings, must be<br />
saved immediately in a text file on the removable disk<br />
(<strong>Accu</strong>-<strong>Chek</strong> <strong>Smart</strong> <strong>Pix</strong>), as described below. If you<br />
leave this page (e.g. by clicking on another link or<br />
closing the browser) without saving your selection,<br />
any change you have made will have no effect.<br />
As soon as you click on the Save button in the Personal Setup<br />
window, another window opens in the browser showing text<br />
which contains your settings for this area. Now proceed as<br />
follows:<br />
• Click the Save link beneath the text or<br />
• select the Save as… command from the File menu<br />
In the next dialog box, select the storage location, the name<br />
and other file attributes:<br />
• Select removable disk (<strong>Accu</strong>-<strong>Chek</strong> <strong>Smart</strong> <strong>Pix</strong>) as<br />
storage location.<br />
• The following settings are defaults and must not be<br />
changed (if displayed):<br />
– Name “Settings”<br />
– File type “Text file (*.txt)”<br />
– Code “Unicode (UTF-8)”<br />
• If all entries are correct, click on the Save button and<br />
close the text window via the close box (top right<br />
of the window).<br />
The text file created in this manner is read by the <strong>Accu</strong>-<strong>Chek</strong><br />
<strong>Smart</strong> <strong>Pix</strong> system, and all entries are adopted as settings for<br />
the <strong>Accu</strong>-<strong>Chek</strong> <strong>Smart</strong> <strong>Pix</strong> system (until they are changed<br />
again). The file is then deleted.<br />
2-10 <strong>Accu</strong>-<strong>Chek</strong> <strong>Smart</strong> <strong>Pix</strong> user's manual
Chapter 2, Installing the <strong>Accu</strong>-<strong>Chek</strong> <strong>Smart</strong> <strong>Pix</strong> system<br />
Report Setup<br />
On the navigation bar, click on the Report Setup link. The<br />
display pane now shows the options for reports to be created<br />
in the future. Select the following settings here:<br />
• Time Range for the reports to be created, for blood<br />
glucose meters (1, 2, 4, 6, 8, 10 or 12 weeks) and<br />
insulin pumps (1, 2 or 4 weeks) separately.<br />
• Target Range for blood glucose results, defined by an<br />
upper and lower limit and by the hypo(glycemic) limit.<br />
These values may have also been configured<br />
externally in smaller intervals. In this case, the values<br />
are displayed in grey. If you want to change these<br />
kinds of values, you can only choose from the normal<br />
(and limited) selection of predefined values.<br />
• Report Style of the analyses. This selection influences<br />
the level of detail for the chart.<br />
• Sort order of displayed Lists (sorted in ascending or<br />
descending order).<br />
• Use of one or more meters to perform a combined<br />
analysis of data.<br />
Selecting a time range<br />
• Click on the arrow pointing down to open the<br />
selection list, for blood glucose meters and insulin<br />
pumps separately.<br />
• Click the desired time range to select it.<br />
<strong>Accu</strong>-<strong>Chek</strong> <strong>Smart</strong> <strong>Pix</strong> user's manual 2-11
Chapter 2, Installing the <strong>Accu</strong>-<strong>Chek</strong> <strong>Smart</strong> <strong>Pix</strong> system<br />
Target range<br />
• Click on the arrow pointing down to open the<br />
selection list, for lower limit and upper limit separately.<br />
• Click the desired figure to select it.<br />
• Click the arrow pointing down to open the selection<br />
list and define the hypo limit.<br />
• Click the desired figure to select it.<br />
Preferred report style<br />
Some graphic reports can be displayed in two different<br />
styles. The main difference between these styles is their level<br />
of detail. Reports in the Detailed style display precise<br />
trends including individual values. The report style<br />
Trends allows for an easy interpretation of trends and<br />
developments (without showing individual values). You can<br />
set up the Trend Graph, Day Graph and Week Graph report<br />
styles separately.<br />
For detailed information on differences between these report<br />
styles, see section “Report Styles” on page 4-5.<br />
Sorting lists<br />
For both blood glucose and insulin pump information there<br />
are reports which are displayed as lists. Use this setting to<br />
determine whether the list starts with the most recent<br />
or the oldest value .<br />
2-12 <strong>Accu</strong>-<strong>Chek</strong> <strong>Smart</strong> <strong>Pix</strong> user's manual
Chapter 2, Installing the <strong>Accu</strong>-<strong>Chek</strong> <strong>Smart</strong> <strong>Pix</strong> system<br />
Combined analysis of meters<br />
If you use more than one meter (e.g. one during the day/one<br />
during the night), it is a good idea to display the data of all<br />
meters together in the reports. You can analyse up to three<br />
meters at a time. Choose whether you want to analyse only<br />
one or several meters.<br />
i<br />
To be able to analyse the combined data properly, all<br />
meters used should have the same date and time<br />
settings. Only then can data from the analyses be<br />
used to make valid decisions concerning your<br />
treatment.<br />
• When you have completed all your settings on this<br />
page, click the Save button to send the new selection<br />
made to the <strong>Accu</strong>-<strong>Chek</strong> <strong>Smart</strong> <strong>Pix</strong> system.<br />
i<br />
If you leave this page (e.g. by clicking on another link<br />
or closing the browser) without saving your selection,<br />
any change you have made will have no effect.<br />
<strong>Accu</strong>-<strong>Chek</strong> <strong>Smart</strong> <strong>Pix</strong> user's manual 2-13
Chapter 2, Installing the <strong>Accu</strong>-<strong>Chek</strong> <strong>Smart</strong> <strong>Pix</strong> system<br />
Completing configuration<br />
When you have made all the settings according to your<br />
requirements and wish to read data from a meter or insulin<br />
pump immediately, please prepare the device accordingly<br />
(see Chapter 3). Then click on the Read Device button (starts<br />
search mode).<br />
Please observe the following points concerning search<br />
mode:<br />
• If you start search mode by clicking on the Read<br />
Device button, the search mode is automatically<br />
stopped after a certain time, unless a device is found.<br />
In this case, an appropriate error message appears.<br />
• If you unplug the <strong>Accu</strong>-<strong>Chek</strong> <strong>Smart</strong> <strong>Pix</strong> device, then<br />
plug it back in (or, in the meantime, switch off the<br />
computer and switch it back on), the device launches<br />
search mode automatically. In this case, however,<br />
search mode is not stopped after a certain time but<br />
continues until a device is found.<br />
If you prefer to familiarise yourself with the preparation<br />
process for devices or other issues first, after having made all<br />
the settings, unplug the <strong>Accu</strong>-<strong>Chek</strong> <strong>Smart</strong> <strong>Pix</strong> device from the<br />
USB port and plug it back in. This puts the device in<br />
continuous search mode, and you do not have to perform the<br />
following steps within a limited timeframe.<br />
When you unplug the USB cable, the browser window may<br />
close. If it does, simply plug in the <strong>Accu</strong>-<strong>Chek</strong> <strong>Smart</strong> <strong>Pix</strong><br />
device again and open the START.HTM file again with a<br />
double click.<br />
2-14 <strong>Accu</strong>-<strong>Chek</strong> <strong>Smart</strong> <strong>Pix</strong> user's manual
Chapter 3, Preparing the devices<br />
3 Preparing the devices<br />
The <strong>Accu</strong>-<strong>Chek</strong> <strong>Smart</strong> <strong>Pix</strong> system can read and analyse data<br />
from the following devices:<br />
• <strong>Accu</strong>-<strong>Chek</strong> Active<br />
• <strong>Accu</strong>-<strong>Chek</strong> Aviva/Aviva Nano<br />
• <strong>Accu</strong>-<strong>Chek</strong> Aviva Combo/Aviva Expert<br />
• <strong>Accu</strong>-<strong>Chek</strong> Compact/Integra<br />
• <strong>Accu</strong>-<strong>Chek</strong> Compact Plus<br />
• <strong>Accu</strong>-<strong>Chek</strong> Go<br />
• <strong>Accu</strong>-<strong>Chek</strong> Mobile<br />
• <strong>Accu</strong>-<strong>Chek</strong> Performa/Performa Nano<br />
• <strong>Accu</strong>-<strong>Chek</strong> Performa Combo/Performa Expert<br />
• <strong>Accu</strong>-<strong>Chek</strong> Voicemate Plus<br />
as well as from the<br />
• <strong>Accu</strong>-<strong>Chek</strong> Pocket Compass software for handhelds<br />
Using an <strong>Accu</strong>-<strong>Chek</strong> IR Key (accessory), the following<br />
meters can also be used to transfer data:<br />
• <strong>Accu</strong>-<strong>Chek</strong> Advantage<br />
• <strong>Accu</strong>-<strong>Chek</strong> Comfort<br />
• <strong>Accu</strong>-<strong>Chek</strong> Sensor<br />
The following insulin pumps are able to transfer data to the<br />
<strong>Accu</strong>-<strong>Chek</strong> <strong>Smart</strong> <strong>Pix</strong> system:<br />
• <strong>Accu</strong>-<strong>Chek</strong> D-TRONplus<br />
• Disetronic D-TRON (plus)<br />
• <strong>Accu</strong>-<strong>Chek</strong> Spirit<br />
• <strong>Accu</strong>-<strong>Chek</strong> Spirit Combo<br />
Note: Not all devices are available in all countries.<br />
<strong>Accu</strong>-<strong>Chek</strong> <strong>Smart</strong> <strong>Pix</strong> user's manual 3-1
Chapter 3, Preparing the devices<br />
In some cases, these devices require different preparations<br />
in order to be able to transfer data to the <strong>Accu</strong>-<strong>Chek</strong> <strong>Smart</strong><br />
<strong>Pix</strong> system. On the following pages, you will find the<br />
procedure for each device to analyse stored data<br />
successfully. You or the user can also find this information in<br />
the manuals for the meters, insulin pumps and <strong>Accu</strong>-<strong>Chek</strong><br />
Pocket Compass software.<br />
i<br />
i<br />
i<br />
i<br />
Always prepare only one device at a time for data<br />
transfer. Otherwise, data transfer might be interfered<br />
with by simultaneous communication attempts. Also<br />
avoid possible interference by infrared ports of other<br />
devices such as laptops or mobile phones.<br />
Avoid direct extraneous light (e.g. sunlight) because it<br />
may interfere with data transfer.<br />
If you want to analyse combined data from more than<br />
one device (e.g. meter and insulin pump or several<br />
meters), do not click on the Erase Report button<br />
between the data transfers. Start data transfer from<br />
further devices by clicking the Read Device button<br />
after each transfer is completed.<br />
If you want to analyse insulin pump data together<br />
with meter data, the devices must be synchronized,<br />
i.e. all devices involved should have the same date<br />
and time settings. Deviations of ± 5 minutes<br />
maximum are tolerated; if the deviation is greater, no<br />
combined reports are created.<br />
3-2 <strong>Accu</strong>-<strong>Chek</strong> <strong>Smart</strong> <strong>Pix</strong> user's manual
Chapter 3, Preparing the devices<br />
All the descriptions below are based on the following<br />
assumptions:<br />
• The <strong>Accu</strong>-<strong>Chek</strong> <strong>Smart</strong> <strong>Pix</strong> device is already plugged<br />
into the computer.<br />
• The computer is switched on and the operating<br />
system is running.<br />
• The <strong>Accu</strong>-<strong>Chek</strong> <strong>Smart</strong> <strong>Pix</strong> device is ready for data<br />
transfer when the top/bottom dots flash slowly (about<br />
once a second).<br />
• If you have already opened the START.HTM file in the<br />
browser, you will see the picture shown on the left<br />
(search mode).<br />
<strong>Accu</strong>-<strong>Chek</strong> <strong>Smart</strong> <strong>Pix</strong> user's manual 3-3
Chapter 3, Preparing the devices<br />
3.1 <strong>Accu</strong>-<strong>Chek</strong> Active<br />
The <strong>Accu</strong>-<strong>Chek</strong> Active meter has a built-in infrared port for<br />
data transfer. In order to read data from these devices,<br />
proceed as follows:<br />
• Place the device no more than 10 cm away from the<br />
infrared window on the <strong>Accu</strong>-<strong>Chek</strong> <strong>Smart</strong> <strong>Pix</strong> device.<br />
Both infrared windows must be facing one another.<br />
• Switch the meter on by keeping the M button pressed<br />
for more than 3 seconds.<br />
• The display shows “PC”, and data transfer starts<br />
automatically.<br />
3-4 <strong>Accu</strong>-<strong>Chek</strong> <strong>Smart</strong> <strong>Pix</strong> user's manual
Chapter 3, Preparing the devices<br />
3.2 <strong>Accu</strong>-<strong>Chek</strong> Aviva/Aviva Nano<br />
The <strong>Accu</strong>-<strong>Chek</strong> Aviva/Aviva Nano meter has a built-in<br />
infrared port for data transfer. In order to read data from<br />
these devices, proceed as follows:<br />
• Place the device no more than 10 cm away from the<br />
infrared window on the <strong>Accu</strong>-<strong>Chek</strong> <strong>Smart</strong> <strong>Pix</strong> device.<br />
Both infrared windows must be facing one another.<br />
• Switch the meter on by keeping the and<br />
buttons pressed simultaneously until two alternately<br />
flashing arrows appear on the display. Data transfer<br />
starts automatically.<br />
<strong>Accu</strong>-<strong>Chek</strong> <strong>Smart</strong> <strong>Pix</strong> user's manual 3-5
Chapter 3, Preparing the devices<br />
3.3 <strong>Accu</strong>-<strong>Chek</strong> Aviva Combo/Aviva Expert<br />
The <strong>Accu</strong>-<strong>Chek</strong> Aviva Combo/Aviva Expert meter has a builtin<br />
infrared port for data transfer. In order to read data from<br />
these devices, proceed as follows:<br />
• Place the device no more than 10 cm away from the<br />
infrared window on the <strong>Accu</strong>-<strong>Chek</strong> <strong>Smart</strong> <strong>Pix</strong> device.<br />
Both infrared windows must be facing one another.<br />
10:02 2 Feb 09<br />
bG Test<br />
Bolus Advice<br />
Pump<br />
My Data<br />
Settings<br />
10:00 2 Feb 09<br />
View Data<br />
Add Data<br />
Reports<br />
Data Transfer<br />
Menu<br />
Data Transfer<br />
• In the main menu, select My Data and press .<br />
• Select Data Transfer and press .<br />
The data is now transferred. When data transfer has been<br />
completed, the Complete display is shown for three seconds.<br />
Then, the meter turns off.<br />
i<br />
If you use the <strong>Accu</strong>-<strong>Chek</strong> Aviva Combo meter<br />
together with an <strong>Accu</strong>-<strong>Chek</strong> Spirit Combo insulin<br />
pump, you should always read the data from both<br />
devices at the same time in order to get information<br />
that is as complete as possible (especially concerning<br />
bolus quantities and basal rates).<br />
Transferring Data<br />
Data Transfer<br />
Complete<br />
3-6 <strong>Accu</strong>-<strong>Chek</strong> <strong>Smart</strong> <strong>Pix</strong> user's manual
Chapter 3, Preparing the devices<br />
3.4 <strong>Accu</strong>-<strong>Chek</strong> Compact/Integra<br />
The <strong>Accu</strong>-<strong>Chek</strong> Compact/Integra meter has a built-in<br />
infrared port for data transfer. In order to read data from<br />
these devices, proceed as follows:<br />
• Place the device no more than 10 cm away from the<br />
infrared window on the <strong>Accu</strong>-<strong>Chek</strong> <strong>Smart</strong> <strong>Pix</strong> device.<br />
Both infrared windows must be facing one another.<br />
• Switch the meter on by pressing the SET and MEMO<br />
buttons simultaneously. The device is now switched<br />
on and in data transfer mode, without advancing<br />
a new test strip.<br />
• The display shows two arrows, and data transfer starts<br />
automatically.<br />
<strong>Accu</strong>-<strong>Chek</strong> <strong>Smart</strong> <strong>Pix</strong> user's manual 3-7
Chapter 3, Preparing the devices<br />
3.5 <strong>Accu</strong>-<strong>Chek</strong> Compact Plus<br />
The <strong>Accu</strong>-<strong>Chek</strong> Compact Plus meter has a built-in infrared<br />
port for data transfer. In order to read data from these<br />
devices, proceed as follows:<br />
• Place the device no more than 10 cm away from the<br />
infrared window on the <strong>Accu</strong>-<strong>Chek</strong> <strong>Smart</strong> <strong>Pix</strong> device.<br />
Both infrared windows must be facing one another.<br />
• Switch the meter on by pressing the S and M buttons<br />
simultaneously. The device is now switched on and in<br />
data transfer mode, without advancing a new test<br />
strip.<br />
• The display shows two arrows, and data transfer starts<br />
automatically.<br />
3-8 <strong>Accu</strong>-<strong>Chek</strong> <strong>Smart</strong> <strong>Pix</strong> user's manual
Chapter 3, Preparing the devices<br />
3.6 <strong>Accu</strong>-<strong>Chek</strong> Go<br />
The <strong>Accu</strong>-<strong>Chek</strong> Go meter has a built-in infrared port for data<br />
transfer. In order to read data from these devices, proceed as<br />
follows:<br />
• Place the device no more than 10 cm away from the<br />
infrared window on the <strong>Accu</strong>-<strong>Chek</strong> <strong>Smart</strong> <strong>Pix</strong> device.<br />
Both infrared windows must be facing one another.<br />
• Switch the meter on by keeping the M button pressed<br />
for more than 3 seconds.<br />
• The display shows “PC”, and data transfer starts<br />
automatically.<br />
If you have the <strong>Accu</strong>-<strong>Chek</strong> Go meter version shown in the<br />
illustration to the left, proceed as follows:<br />
• Place the device no more than 10 cm away from the<br />
infrared window on the <strong>Accu</strong>-<strong>Chek</strong> <strong>Smart</strong> <strong>Pix</strong> device.<br />
Both infrared windows must be facing one another.<br />
• Switch the meter on by pressing the and<br />
buttons simultaneously.<br />
• The display shows “PC”, and data transfer starts<br />
automatically.<br />
<strong>Accu</strong>-<strong>Chek</strong> <strong>Smart</strong> <strong>Pix</strong> user's manual 3-9
Chapter 3, Preparing the devices<br />
3.7 <strong>Accu</strong>-<strong>Chek</strong> Mobile<br />
The <strong>Accu</strong>-<strong>Chek</strong> Mobile meter has a built-in infrared port for<br />
data transfer. In order to read data from these devices,<br />
proceed as follows:<br />
• Place the device no more than 10 cm away from the<br />
infrared window on the <strong>Accu</strong>-<strong>Chek</strong> <strong>Smart</strong> <strong>Pix</strong> device.<br />
Both infrared windows must be facing one another.<br />
• Keep the and buttons pressed until the meter<br />
turns on<br />
• Wait for the display check to be completed and the<br />
Transfer data menu to be displayed.<br />
• In the Transfer data menu, select For analysis and press<br />
.<br />
The connection is now established, and the data is<br />
transferred. When data transfer has been completed, the<br />
Transfer finished display is shown for two seconds. Then, the<br />
meter turns off.<br />
3-10 <strong>Accu</strong>-<strong>Chek</strong> <strong>Smart</strong> <strong>Pix</strong> user's manual
Chapter 3, Preparing the devices<br />
3.8 <strong>Accu</strong>-<strong>Chek</strong> Sensor/Advantage<br />
5<br />
The <strong>Accu</strong>-<strong>Chek</strong> Sensor/Advantage meters use the contacts<br />
for the code chip as an interface for data transfer. In order to<br />
read data from these devices, proceed as follows:<br />
• Leave the device switched off during the entire<br />
process.<br />
• Remove the code chip from the meter.<br />
• Remove the <strong>Accu</strong>-<strong>Chek</strong> IR Key 5 from the slot on the<br />
back of the <strong>Accu</strong>-<strong>Chek</strong> <strong>Smart</strong> <strong>Pix</strong> device (if that is<br />
where you store it).<br />
• Insert the <strong>Accu</strong>-<strong>Chek</strong> IR Key into the meter in place of<br />
the code chip.<br />
• Place the device no more than 10 cm away from the<br />
infrared window on the <strong>Accu</strong>-<strong>Chek</strong> <strong>Smart</strong> <strong>Pix</strong> device.<br />
Both infrared windows must be facing one another.<br />
• Data transfer starts automatically.<br />
When data transfer has been completed and the report is<br />
displayed on the screen:<br />
• Remove the <strong>Accu</strong>-<strong>Chek</strong> IR Key from the meter and<br />
return it to the place where you normally store it (e.g.<br />
the slot on the back of the <strong>Accu</strong>-<strong>Chek</strong> <strong>Smart</strong> <strong>Pix</strong><br />
device).<br />
• Re-insert the code chip into the meter.<br />
<strong>Accu</strong>-<strong>Chek</strong> <strong>Smart</strong> <strong>Pix</strong> user's manual 3-11
Chapter 3, Preparing the devices<br />
3.9 <strong>Accu</strong>-<strong>Chek</strong> Comfort<br />
5<br />
The <strong>Accu</strong>-<strong>Chek</strong> Comfort meters use the contacts for the<br />
code chip as an interface for data transfer. In order to read<br />
data from these devices, proceed as follows:<br />
• Leave the device switched off during the entire<br />
process.<br />
• Remove the code chip from the meter.<br />
• Remove the <strong>Accu</strong>-<strong>Chek</strong> IR Key 5 from the slot on the<br />
back of the <strong>Accu</strong>-<strong>Chek</strong> <strong>Smart</strong> <strong>Pix</strong> device (if that is<br />
where you store it).<br />
• Insert the <strong>Accu</strong>-<strong>Chek</strong> IR Key into the meter in place of<br />
the code chip.<br />
• Place the device no more than 10 cm away from the<br />
infrared window on the <strong>Accu</strong>-<strong>Chek</strong> <strong>Smart</strong> <strong>Pix</strong> device.<br />
Both infrared windows must be facing one another.<br />
• Data transfer starts automatically.<br />
When data transfer has been completed and the report is<br />
displayed on the screen:<br />
• Remove the <strong>Accu</strong>-<strong>Chek</strong> IR Key from the meter and<br />
return it to the place where you normally store it (e.g.<br />
the slot on the back of the <strong>Accu</strong>-<strong>Chek</strong> <strong>Smart</strong> <strong>Pix</strong><br />
device).<br />
• Re-insert the code chip into the meter.<br />
3-12 <strong>Accu</strong>-<strong>Chek</strong> <strong>Smart</strong> <strong>Pix</strong> user's manual
Chapter 3, Preparing the devices<br />
3.10 <strong>Accu</strong>-<strong>Chek</strong> Performa/Performa Nano<br />
The <strong>Accu</strong>-<strong>Chek</strong> Performa/Performa Nano meter has a builtin<br />
infrared port for data transfer. In order to read data from<br />
these devices, proceed as follows:<br />
• Place the device no more than 10 cm away from the<br />
infrared window on the <strong>Accu</strong>-<strong>Chek</strong> <strong>Smart</strong> <strong>Pix</strong> device.<br />
Both infrared windows must be facing one another.<br />
• Switch the meter on by keeping the and<br />
buttons pressed simultaneously until two alternately<br />
flashing arrows appear on the display. Data transfer<br />
starts automatically.<br />
<strong>Accu</strong>-<strong>Chek</strong> <strong>Smart</strong> <strong>Pix</strong> user's manual 3-13
Chapter 3, Preparing the devices<br />
3.11 <strong>Accu</strong>-<strong>Chek</strong> Performa Combo/Performa Expert<br />
The <strong>Accu</strong>-<strong>Chek</strong> Performa Combo/Performa Expert meter has<br />
a built-in infrared port for data transfer. In order to read data<br />
from these devices, proceed as follows:<br />
• Place the device no more than 10 cm away from the<br />
infrared window on the <strong>Accu</strong>-<strong>Chek</strong> <strong>Smart</strong> <strong>Pix</strong> device.<br />
Both infrared windows must be facing one another.<br />
10:02 2 Feb 09<br />
bG Test<br />
Bolus Advice<br />
Pump<br />
My Data<br />
Settings<br />
10:00 2 Feb 09<br />
View Data<br />
Add Data<br />
Reports<br />
Data Transfer<br />
Menu<br />
Data Transfer<br />
• In the main menu, select My Data and press .<br />
• Select Data Transfer and press .<br />
The data is now transferred. When data transfer has been<br />
completed, the Complete display is shown for three seconds.<br />
Then, the meter turns off.<br />
i<br />
If you use the <strong>Accu</strong>-<strong>Chek</strong> Performa Combo meter<br />
together with an <strong>Accu</strong>-<strong>Chek</strong> Spirit Combo insulin<br />
pump, you should always read data from both devices<br />
at the same time in order to get information that is as<br />
complete as possible (especially concerning bolus<br />
quantities and basal rates).<br />
Transferring Data<br />
Data Transfer<br />
Complete<br />
3-14 <strong>Accu</strong>-<strong>Chek</strong> <strong>Smart</strong> <strong>Pix</strong> user's manual
Chapter 3, Preparing the devices<br />
3.12 <strong>Accu</strong>-<strong>Chek</strong> Pocket Compass software<br />
<strong>Accu</strong>-<strong>Chek</strong> 10:05 am 3/20/05<br />
Data Transfer<br />
Diary<br />
Reports<br />
Health Management<br />
Options<br />
Data Transfer 3/20/05<br />
Import Data<br />
Export Data<br />
Sync. Devices<br />
Information<br />
The <strong>Accu</strong>-<strong>Chek</strong> Pocket Compass software uses the infrared<br />
port of a handheld computer for data transfer. In order to<br />
read data from the handheld computer, proceed as follows:<br />
• Place the handheld computer no more than 10 cm<br />
away from the infrared window on the <strong>Accu</strong>-<strong>Chek</strong><br />
<strong>Smart</strong> <strong>Pix</strong> device. Both infrared windows must be<br />
facing one another.<br />
• Turn the handheld on and start the <strong>Accu</strong>-<strong>Chek</strong> Pocket<br />
Compass software.<br />
• On the main menu screen, touch Data Transfer.<br />
• Then touch Export Data.<br />
• Data transfer starts automatically.<br />
Menu<br />
Export Data<br />
Transferring data...<br />
Cancel<br />
<strong>Accu</strong>-<strong>Chek</strong> <strong>Smart</strong> <strong>Pix</strong> user's manual 3-15
Chapter 3, Preparing the devices<br />
3.13 <strong>Accu</strong>-<strong>Chek</strong> Voicemate Plus<br />
The <strong>Accu</strong>-<strong>Chek</strong> Voicemate Plus voice unit has a built-in<br />
infrared port for data transfer. In order to read data from<br />
these devices, proceed as follows:<br />
• Place the device no more than 10 cm away from the<br />
infrared window on the <strong>Accu</strong>-<strong>Chek</strong> <strong>Smart</strong> <strong>Pix</strong> device.<br />
Both infrared windows must be facing one another.<br />
On the <strong>Accu</strong>-<strong>Chek</strong> Voicemate Plus voice unit, the<br />
infrared port is located on the right side of the device<br />
near the numeric keypad.<br />
• Switch on the voice unit, press the 0 key once and the<br />
3 key twice (Data transfer menu, Transfer data to PC<br />
via IR).<br />
• Data transfer starts automatically.<br />
3-16 <strong>Accu</strong>-<strong>Chek</strong> <strong>Smart</strong> <strong>Pix</strong> user's manual
Chapter 3, Preparing the devices<br />
3.14 <strong>Insulin</strong> pump <strong>Accu</strong>-<strong>Chek</strong> D-TRONplus (and Disetronic D-TRONplus)<br />
The <strong>Accu</strong>-<strong>Chek</strong> D-TRONplus (Disetronic D-TRONplus)<br />
insulin pump has a built-in infrared port for data transfer. In<br />
order to read data from these devices, proceed as follows:<br />
• Place the device no more than 10 cm away from the<br />
infrared window on the <strong>Accu</strong>-<strong>Chek</strong> <strong>Smart</strong> <strong>Pix</strong> device.<br />
Both infrared windows must be facing one another.<br />
• Make sure that your <strong>Accu</strong>-<strong>Chek</strong> (Disetronic)<br />
DTRONplus insulin pump is in STOP mode and that<br />
the key lock (KeyLock) is deactivated or unlocked.<br />
• Press the button 4 times to select the “Data<br />
Transfer” function.<br />
• Confirm the selection with the button. The built-in<br />
infrared port is now activated, and data transfer starts<br />
automatically.<br />
When data transfer has been completed and the report is<br />
displayed on the screen:<br />
• Press the button to quit data transfer mode.<br />
• Resume operation of the insulin pump (RUN mode)<br />
so as not to interrupt the supply of insulin according<br />
to your basal rate for longer than necessary.<br />
<strong>Accu</strong>-<strong>Chek</strong> <strong>Smart</strong> <strong>Pix</strong> user's manual 3-17
Chapter 3, Preparing the devices<br />
3.15 <strong>Accu</strong>-<strong>Chek</strong> Spirit insulin pump<br />
The <strong>Accu</strong>-<strong>Chek</strong> Spirit insulin pump has a built-in infrared<br />
port for data transfer. In order to read data from these<br />
devices, proceed as follows:<br />
• Place the device no more than 10 cm away from the<br />
infrared window on the <strong>Accu</strong>-<strong>Chek</strong> <strong>Smart</strong> <strong>Pix</strong> device.<br />
Both infrared windows must be facing one another.<br />
15:29 26.05<br />
• Make sure that your <strong>Accu</strong>-<strong>Chek</strong> Spirit insulin pump is<br />
in STOP mode.<br />
DATA<br />
COMMUNICATION<br />
• Press the button repeatedly until the DATA<br />
COMMUNICATION function is displayed.<br />
DATA TRANSFER<br />
• Confirm the selection with the button. The builtin<br />
infrared port is now activated, and data transfer<br />
starts automatically.<br />
When data transfer has been completed and the report is<br />
displayed on the screen:<br />
• Press the button to quit data transfer mode.<br />
• Resume operation of the insulin pump (RUN mode)<br />
so as not to interrupt the supply of insulin according<br />
to your basal rate for longer than necessary.<br />
3-18 <strong>Accu</strong>-<strong>Chek</strong> <strong>Smart</strong> <strong>Pix</strong> user's manual
Chapter 3, Preparing the devices<br />
3.16 <strong>Accu</strong>-<strong>Chek</strong> Spirit Combo insulin pump<br />
The <strong>Accu</strong>-<strong>Chek</strong> Spirit Combo insulin pump has a built-in<br />
infrared port for data transfer. In order to read data from<br />
these devices, proceed as follows:<br />
• Place the device no more than 10 cm away from the<br />
infrared window on the <strong>Accu</strong>-<strong>Chek</strong> <strong>Smart</strong> <strong>Pix</strong> device.<br />
Both infrared windows must be facing one another.<br />
10:59 26.05<br />
DATA<br />
TRANSFER<br />
DATATRANSFER<br />
START<br />
DATATRANSFER<br />
STOP<br />
• Make sure that your <strong>Accu</strong>-<strong>Chek</strong> Spirit Combo insulin<br />
pump is in STOP mode.<br />
• Press the button repeatedly until the DATA<br />
TRANSFER screen is displayed.<br />
• Confirm the selection with the button.<br />
• Press the button again to start data transfer. The<br />
built-in infrared port is now activated, and data<br />
transfer starts automatically.<br />
When data transfer has been completed and the report is<br />
displayed on the screen:<br />
• Press the button to quit data transfer mode.<br />
• Resume operation of the insulin pump (RUN mode)<br />
so as not to interrupt the supply of insulin according<br />
to your basal rate for longer than necessary.<br />
<strong>Accu</strong>-<strong>Chek</strong> <strong>Smart</strong> <strong>Pix</strong> user's manual 3-19
Chapter 3, Preparing the devices<br />
3.17 Note on time settings for the <strong>Accu</strong>-<strong>Chek</strong> insulin pumps<br />
If you have to correct the time set in your <strong>Accu</strong>-<strong>Chek</strong> insulin<br />
pump, please observe the following:<br />
i<br />
Do not change the time on your <strong>Accu</strong>-<strong>Chek</strong> insulin<br />
pump if you have programmed time-based changes<br />
of insulin delivery (e.g. temporary basal rate, extended<br />
bolus or multiwave bolus) and this change is still in<br />
effect (i.e. the programmed period of time has not yet<br />
elapsed).<br />
In this case, the <strong>Accu</strong>-<strong>Chek</strong> <strong>Smart</strong> <strong>Pix</strong> system may not be<br />
able to analyse the stored insulin pump data. Therefore, only<br />
change the time set in your insulin pump if it is in STOP<br />
mode.<br />
If you want to reset the time programmed in your <strong>Accu</strong>-<strong>Chek</strong><br />
insulin pump (e.g. at the end of the summer time or due to<br />
time zone changes when travelling to Western directions)<br />
and to analyse the existing data using the <strong>Accu</strong>-<strong>Chek</strong><br />
<strong>Smart</strong> <strong>Pix</strong> system:<br />
i<br />
Before changing the time, read the existing data from<br />
your <strong>Accu</strong>-<strong>Chek</strong> insulin pump. The next time data is<br />
read, the <strong>Accu</strong>-<strong>Chek</strong> <strong>Smart</strong> <strong>Pix</strong> system only analyses<br />
the insulin pump data which was stored after the<br />
time was reset.<br />
If you use your insulin pump together with a blood glucose<br />
meter and want to analyse the data of both devices using the<br />
<strong>Accu</strong>-<strong>Chek</strong> <strong>Smart</strong> <strong>Pix</strong> system, always change the time for all<br />
devices at once. This ensures that the information<br />
represented in the reports is assigned correctly. Combined<br />
reports are only created for devices having the same date<br />
and time settings.<br />
3-20 <strong>Accu</strong>-<strong>Chek</strong> <strong>Smart</strong> <strong>Pix</strong> user's manual
Chapter 4, <strong>Accu</strong>-<strong>Chek</strong> Report<br />
4 <strong>Accu</strong>-<strong>Chek</strong> Report<br />
If you have initiated the transfer of data from a meter, an<br />
insulin pump or the <strong>Accu</strong>-<strong>Chek</strong> Pocket Compass software, as<br />
described in the previous chapter, the following now occurs:<br />
• The top/bottom dots on the status indicator flash<br />
quickly during the data transfer. Make sure not to<br />
move the devices during this process, so as not to<br />
interfere with the data transfer.<br />
• When the data has been transferred, the <strong>Accu</strong>-<strong>Chek</strong><br />
<strong>Smart</strong> <strong>Pix</strong> system prepares the reports. The two left/<br />
right dots on the status indicator flash (more slowly)<br />
during this process.<br />
• When the reports have been completed, the centre of<br />
the status indicator is lit continuously. This means the<br />
reports are now available on the computer and the<br />
device search has been switched off (standby mode).<br />
The data stored in the meter or insulin pump is not deleted<br />
after data transfer.<br />
The <strong>Accu</strong>-<strong>Chek</strong> <strong>Smart</strong> <strong>Pix</strong> system creates reports<br />
(<strong>Accu</strong>-<strong>Chek</strong> Report) with various graphic and statistical<br />
analyses. All the elements of a report are always available on<br />
the screen. Your decision on which report elements to print<br />
out can be made on a case-by-case basis.<br />
<strong>Accu</strong>-<strong>Chek</strong> <strong>Smart</strong> <strong>Pix</strong> user's manual 4-1
Chapter 4, <strong>Accu</strong>-<strong>Chek</strong> Report<br />
4.1 Printing reports<br />
All the reports displayed on the screen can also be printed<br />
out.<br />
Do not use the integrated print function of the browser to<br />
print one or more reports after data transfer, instead use the<br />
special print functions offered by the <strong>Accu</strong>-<strong>Chek</strong> <strong>Smart</strong> <strong>Pix</strong><br />
system.<br />
• In any view of the report, click on the Create Report<br />
button on the menu bar.<br />
• Select the reports you want to prepare for printing.<br />
• Now click on the Create Report button at the bottom<br />
of the screen.<br />
• In the preview that is now displayed, click on the Print<br />
button.<br />
• In the next dialog box, you can select the printer and<br />
configure it if necessary. Click on the Print button<br />
when you want to start printing the report on the<br />
printer you have selected.<br />
• Close the window showing the print preview.<br />
If you only wish to print the currently displayed analysis, use<br />
the Print Page button below the relevant report.<br />
4-2 <strong>Accu</strong>-<strong>Chek</strong> <strong>Smart</strong> <strong>Pix</strong> user's manual
Chapter 4, <strong>Accu</strong>-<strong>Chek</strong> Report<br />
4.2 Blood glucose: general information about the reports<br />
Types of report<br />
The <strong>Accu</strong>-<strong>Chek</strong> <strong>Smart</strong> <strong>Pix</strong> system creates single-page or<br />
multi-page reports for defined periods (e.g. the last 2 or<br />
4 weeks). The period of time and the style of the report have<br />
been set during configuration. A (blood glucose) report can<br />
generally contain any of the following elements:<br />
[1] Trend Graph<br />
[2] Day Graph<br />
[3] Week Graph<br />
[4] Metabolic Control<br />
[5] Distribution<br />
[6] Logbook<br />
[7] Overview<br />
[8] Record List<br />
The illustration on the left shows examples of the printed<br />
version of the report.<br />
<strong>Accu</strong>-<strong>Chek</strong> <strong>Smart</strong> <strong>Pix</strong> user's manual 4-3
Chapter 4, <strong>Accu</strong>-<strong>Chek</strong> Report<br />
Evaluated data<br />
During creation of the individual analyses, the data read is<br />
checked by the <strong>Accu</strong>-<strong>Chek</strong> <strong>Smart</strong> <strong>Pix</strong> system. The following<br />
data is not included in the statistical analysis:<br />
• Test results outside the period selected<br />
• Test results saved without date and time<br />
• Tests with control solution<br />
• Invalid/deleted tests<br />
• Tests outside the measuring range<br />
(marked Hi/Lo)<br />
You will find some of this information summarized in the<br />
overview (e.g. number of Hi/Lo results) or in the logbook and<br />
the record list (e.g. results without a date or time, tests with<br />
control solution).<br />
Existing target range definitions are only adopted from the<br />
<strong>Accu</strong>-<strong>Chek</strong> Pocket Compass software. Apart from that, the<br />
settings made during configuration of the <strong>Accu</strong>-<strong>Chek</strong><br />
<strong>Smart</strong> <strong>Pix</strong> system apply.<br />
Please note the following when using the <strong>Accu</strong>-<strong>Chek</strong><br />
<strong>Smart</strong> <strong>Pix</strong> system with several meters:<br />
To ensure that the report belonging to a<br />
particular meter is displayed, compare the serial<br />
number on the meter with the serial number<br />
displayed in the report.<br />
4-4 <strong>Accu</strong>-<strong>Chek</strong> <strong>Smart</strong> <strong>Pix</strong> user's manual
Chapter 4, <strong>Accu</strong>-<strong>Chek</strong> Report<br />
Report Styles<br />
For some analyses a style is defined, either Detailed<br />
or Trends , during configuration of the <strong>Accu</strong>-<strong>Chek</strong><br />
<strong>Smart</strong> <strong>Pix</strong> system. These two styles offer different types of<br />
presentation for identical information. You can choose from<br />
these styles for each of the following analyses individually:<br />
• Trend Graph<br />
• Day Graph<br />
• Week Graph<br />
Detailed These analyses are represented in linear<br />
form. Each test result is plotted along the time axis according<br />
to the time when the test was performed. Test results<br />
performed within a 10 hour period are connected by a line.<br />
This creates (angular) “curves” which, together with the<br />
actual test result entry, make it possible to obtain a detailed<br />
analysis of individual results and trends.<br />
<strong>Insulin</strong> and carbohydrate amounts (displayed in the upper<br />
and lower edge of the report, if transferred by the device)<br />
can only be displayed in this report style.<br />
Trends These analyses are time block-related, i.e.<br />
all the test results within a certain period are assigned to a<br />
single time block. The figures displayed are the mean value,<br />
the variance, the minimum and the maximum of those test<br />
results. A selective analysis of individual results is not<br />
possible, but it is easier to make statements about general<br />
trends within certain periods of time (time blocks/days/<br />
weekdays).<br />
<strong>Accu</strong>-<strong>Chek</strong> <strong>Smart</strong> <strong>Pix</strong> user's manual 4-5
Chapter 4, <strong>Accu</strong>-<strong>Chek</strong> Report<br />
Graphic elements of the reports<br />
On all reports, you will find legends explaining the meaning<br />
of individual elements. Here are detailed explanations of the<br />
various elements.<br />
Colours When flagging blood glucose values, the same<br />
colours have the same meaning in all blood glucose<br />
analyses, irrespective of the particular graphic element being<br />
used. On the reports, you will find the following colour codes:<br />
• Dark blue means “above target range”. This colour is<br />
used:<br />
– within the Distribution bar charts<br />
– in the Logbook and the Record List<br />
• Yellow means “within target range”. This colour is<br />
used:<br />
– as background colour for the Trend Graph, Day<br />
Graph and Week Graph reports<br />
– within the Distribution bar charts<br />
• Red means “below target range” or “Hypo”. This<br />
colour is used:<br />
– within the Distribution bar charts<br />
– in the Logbook and the Record List<br />
Individual test results below the hypo limit and results<br />
marked “Hypo Symptoms” are also displayed in red.<br />
• Green indicates those days that are usually nonworking<br />
days.<br />
<strong>Insulin</strong> values are also shown in different colours, however,<br />
the meanings mentioned above (for blood glucose results)<br />
do not apply for insulin values. The colours are only used as<br />
a means to distinguish different insulin types.<br />
4-6 <strong>Accu</strong>-<strong>Chek</strong> <strong>Smart</strong> <strong>Pix</strong> user's manual
Chapter 4, <strong>Accu</strong>-<strong>Chek</strong> Report<br />
Symbols (Detailed) Test results are plotted on<br />
the analysis using various symbols that give additional<br />
information:<br />
Mean value for the respective time interval.<br />
Blood glucose result without any additional information.<br />
Results below the hypo limit are shown in red.<br />
Blood glucose result before or after meal. Results<br />
below the hypo limit are shown in red.<br />
Result outside the measuring range (indicated on the meter<br />
as HI or LO)<br />
Blood glucose result above 400 mg/dL or 25 mmol/L.<br />
Blood glucose result (any symbol inside the red circle)<br />
accompanied by hypo(glycemic) symptoms.<br />
Blood glucose result (any symbol inside the black circle) with<br />
a user-defined event (marked with an asterisk * on the blood<br />
glucose meter).<br />
<strong>Insulin</strong> amount for insulin 1 , 2 or 3 respectively. <strong>Insulin</strong><br />
amounts are plotted on the chart from the top downwards.<br />
Carbohydrate amounts; represented at the lower edge in<br />
some analyses. The carbohydrate amount is indicated by the<br />
height of the single block (or the bar, which consists of<br />
several blocks). The bars shown in this illustration (from left<br />
to right) represent the following amounts:<br />
– Block 1: 2.5 g<br />
– Block 2: 5.0 g<br />
– Block 3: 7.5 g<br />
– Bar 4 (3 blocks of 10 g each): 30 g<br />
<strong>Accu</strong>-<strong>Chek</strong> <strong>Smart</strong> <strong>Pix</strong> user's manual 4-7
Chapter 4, <strong>Accu</strong>-<strong>Chek</strong> Report<br />
Symbols (Trends) Here the analysis does not<br />
cover individual test results but mean values in relation to<br />
certain time intervals. Here you will find the following<br />
symbols:<br />
Mean value for the respective time interval.<br />
Standard deviation within a time interval.<br />
Maximum value or minimum value within a time interval.<br />
Maximum value/minimum value outside the measuring<br />
range (Hi/Lo).<br />
Symbols (record lists and logbook) The following<br />
additional symbols are used in the analysis lists:<br />
User-defined event, e.g. Alternative Site Testing (AST)<br />
Hypo<br />
Carbohydrate amount<br />
4-8 <strong>Accu</strong>-<strong>Chek</strong> <strong>Smart</strong> <strong>Pix</strong> user's manual
Chapter 4, <strong>Accu</strong>-<strong>Chek</strong> Report<br />
Test results which have been imported from the <strong>Accu</strong>-<strong>Chek</strong><br />
Pocket Compass software may include additional information<br />
(events) which is not represented by symbols. Such events<br />
are indicated by a number or letter in the comments column<br />
of the record list style. The meanings of these codes are<br />
shown in the following table:<br />
Code<br />
Event<br />
3 Snack<br />
20 Fasting<br />
23 Before exercise<br />
24 After exercise<br />
29 Stress<br />
31 Illness<br />
35 Oral medication<br />
36 User-defined<br />
M Manually entered test result<br />
The symbols previously described are used for all other<br />
events.<br />
<strong>Accu</strong>-<strong>Chek</strong> <strong>Smart</strong> <strong>Pix</strong> user's manual 4-9
Chapter 4, <strong>Accu</strong>-<strong>Chek</strong> Report<br />
4.3 Blood glucose: content of the report<br />
Trend Graph<br />
Detailed: This analysis shows the trend for several test<br />
results over the time range selected. The results which can<br />
be shown in this analysis are the following:<br />
• Blood glucose results<br />
• <strong>Insulin</strong> amounts<br />
• Carbohydrate amounts<br />
You will find the days and months along the horizontal (x)<br />
axis and the blood glucose results along the vertical (y) axis.<br />
For your guidance, the blood glucose results (represented by<br />
various symbols) are connected through a line, provided the<br />
various tests are no more than 10 hours apart. You will find<br />
the meanings of the various symbols in brief in the legend<br />
and in detail on page 4-8.<br />
For further guidance, you can see the set target range in the<br />
background of the chart (in the form of a yellow bar) and the<br />
hypo threshold (in the form of a red line). Days that are<br />
usually non-working days (weekends) are marked with an<br />
additional green bar on the horizontal axis.<br />
In addition to the thin connecting line between the various<br />
blood glucose results, you will also see a (thicker) blue curve;<br />
the day-to-day development of the mean blood glucose level.<br />
4-10 <strong>Accu</strong>-<strong>Chek</strong> <strong>Smart</strong> <strong>Pix</strong> user's manual
Chapter 4, <strong>Accu</strong>-<strong>Chek</strong> Report<br />
This is also where you will find a display of insulin doses (if<br />
transferred by the meter). Each insulin dose is plotted on the<br />
chart from the top downwards and you can read the relevant<br />
levels off the upper area of the right-hand y-axis.<br />
At the lower edge of the analysis, carbohydrate amounts are<br />
shown (if stored in the meter). To facilitate evaluation of the<br />
amounts, the bars are divided into small separate blocks.<br />
Each block represents a carbohydrate amount of 10 g;<br />
smaller blocks stand for a corresponding fraction of that<br />
amount (2.5 g, 5 g or 7.5 g). In the lower area of the righthand<br />
y-axis, you will find the scale for the carbohydrate<br />
amounts.<br />
Trends: Here you will find the mean level for each<br />
individual day from the selected time range, in the form of<br />
a single block (black box containing a horizontal line) for the<br />
respective date. The standard deviation, minimum levels and<br />
maximum levels, etc. are plotted according to the symbols on<br />
page 4-8.<br />
When you position the mouse cursor over a value bar, a<br />
tooltip (help text) will appear at this place after a short period<br />
of time which displays the related figures. These figures are:<br />
• n: Number of analysed test results.<br />
• MBG: Mean value of all analysed results.<br />
• SD: Standard deviation or variance of the analysed<br />
results.<br />
<strong>Accu</strong>-<strong>Chek</strong> <strong>Smart</strong> <strong>Pix</strong> user's manual 4-11
Chapter 4, <strong>Accu</strong>-<strong>Chek</strong> Report<br />
Day Graph<br />
This analysis is used to make it easier to recognise patterns<br />
repeated daily. For this purpose, all the data is placed on<br />
a 24-hour grid. As a result all the tests performed at<br />
(approximately) the same time of day are shown at the same<br />
position on the time axis. If these time blocks are defined in<br />
the meter, the information will be evaluated when the time<br />
axis is set out. If they are not, the time block settings in the<br />
<strong>Accu</strong>-<strong>Chek</strong> <strong>Smart</strong> <strong>Pix</strong> configuration will be used. The analysis<br />
can be displayed in two different styles of presentation.<br />
The one which appears on your report is defined during<br />
configuration.<br />
Detailed: All the blood glucose levels are plotted at the<br />
relevant time of day according to the time when the test was<br />
performed. Levels that have been determined within a period<br />
of 10 hours are connected by a black line in chronological<br />
order. A (thicker) blue curve represents the development of<br />
the mean level (in intervals of one hour if a test result falls in<br />
each interval). Time block boundaries are represented by<br />
vertical grey lines.<br />
This is also where you will find a display of insulin doses (if<br />
stored in the meter). Each insulin dose is plotted on the chart<br />
from the top downwards and you can read the relevant levels<br />
off the upper area of the right-hand y-axis.<br />
At the lower edge of the analysis, carbohydrate amounts are<br />
shown (if stored in the meter). In the lower area of the righthand<br />
y-axis, you will find the scale for the carbohydrate<br />
amounts.<br />
4-12 <strong>Accu</strong>-<strong>Chek</strong> <strong>Smart</strong> <strong>Pix</strong> user's manual
Chapter 4, <strong>Accu</strong>-<strong>Chek</strong> Report<br />
Trends: All the blood glucose levels are assigned to one of<br />
eight time blocks according to the time when the test was<br />
performed. In this way eight areas are created within which<br />
you are shown the average (black box containing a horizontal<br />
line), the standard deviation (blue bar), the minimum level<br />
and the maximum level. The start and end of the time blocks<br />
are plotted on the x-axis.<br />
When you position the mouse cursor over a value bar, a<br />
tooltip (help text) will appear at this place after a short period<br />
of time which displays the related figures. These figures are:<br />
• n: Number of analysed test results.<br />
• MBG: Mean value of all analysed results.<br />
• SD: Standard deviation or variance of the analysed<br />
results.<br />
<strong>Accu</strong>-<strong>Chek</strong> <strong>Smart</strong> <strong>Pix</strong> user's manual 4-13
Chapter 4, <strong>Accu</strong>-<strong>Chek</strong> Report<br />
Week Graph<br />
This analysis is also used to make it easier to recognise<br />
repeated patterns, but in this case it depends on the day of<br />
the week. For example, it is possible to recognise changes in<br />
the metabolic situation brought about by your occupation. As<br />
in the case of the Day Graph, there are two different styles<br />
available for this analysis.<br />
Detailed: All the blood glucose levels are plotted on the<br />
chart according to the time when the test was performed and<br />
the respective day of the week. Here too, levels which are no<br />
more than 10 hours apart are connected by lines in chronological<br />
order to make things clearer. The connecting lines are<br />
also drawn beyond week limits (if applicable). A (thicker)<br />
blue curve represents the development of the mean level on<br />
the different days of the week.<br />
This is also where you will find a display of insulin doses (if<br />
stored in the meter). Each insulin dose is plotted on the chart<br />
from the top downwards and you can read the relevant levels<br />
off the upper area of the right-hand y-axis.<br />
At the lower edge of the analysis, carbohydrate amounts are<br />
shown (if transferred by the meter). In the lower area of the<br />
right-hand y-axis, you will find the scale for the carbohydrate<br />
amounts.<br />
4-14 <strong>Accu</strong>-<strong>Chek</strong> <strong>Smart</strong> <strong>Pix</strong> user's manual
Chapter 4, <strong>Accu</strong>-<strong>Chek</strong> Report<br />
Trends: All the blood glucose levels are assigned to one<br />
of the seven days of the week according to the date.<br />
Accordingly, you will see seven blocks indicating the average<br />
(black box containing a horizontal line), the standard<br />
deviation (blue bar), the minimum level and the maximum<br />
level of the relevant day of the week.<br />
When you position the mouse cursor over a value bar, a<br />
tooltip (help text) will appear at this place after a short period<br />
of time which displays the related figures. These figures are:<br />
• n: Number of analysed test results.<br />
• MBG: Mean value from all analysed results.<br />
• SD: Standard deviation or variance of the analysed<br />
results.<br />
<strong>Accu</strong>-<strong>Chek</strong> <strong>Smart</strong> <strong>Pix</strong> user's manual 4-15
Chapter 4, <strong>Accu</strong>-<strong>Chek</strong> Report<br />
Metabolic Control<br />
For each day of the period analysed the mean blood glucose<br />
level (MBG) and the standard deviation (SD/variance of the<br />
levels) are calculated. These two results together provide the<br />
coordinates at which one entry (per day) is made on the chart.<br />
The mean blood glucose level is plotted along the y-axis<br />
while the standard deviation is plotted along the x-axis.<br />
This type of presentation produces a “point cloud”. To allow<br />
faster assessment of the metabolic situation based on this<br />
general picture, the chart is split up into four “quadrants”.<br />
Each of these quadrants represents a certain constitution of<br />
the metabolic situation and is described by the attributes<br />
“stable/unstable” (depending on the standard deviation) and<br />
“low/high” (depending on the mean blood glucose levels).<br />
Each quadrant thus has two attributes.<br />
Example:<br />
Mean blood glucose levels below 150 mg/dL (or 8.3 mmol/L)<br />
with a standard deviation of less than 50 mg/dL (or<br />
2.8 mmol/L) are plotted in the left lower quadrant<br />
(“stable-low”). If both levels are above those limits, the entry<br />
is made in the right upper quadrant (“unstable-high”).<br />
Two ellipses are plotted, centred around the mean level of all<br />
represented levels (marked by a blue cross). They illustrate<br />
the variance of the daily mean levels and the daily blood<br />
glucose variations over the selected period as a simple<br />
(1 SD) and two-fold (2 SD) standard deviation of the levels<br />
displayed.<br />
Good metabolic control can be recognised by as many dots<br />
as possible in the “stable-low” quadrant (bottom left); there<br />
should, however, have been no cases of hypoglycemia, or as<br />
few as possible in the relevant period.<br />
4-16 <strong>Accu</strong>-<strong>Chek</strong> <strong>Smart</strong> <strong>Pix</strong> user's manual
Chapter 4, <strong>Accu</strong>-<strong>Chek</strong> Report<br />
In addition to the graphical display, you will also find<br />
statistical information on the values which were included in<br />
the analysis. These are:<br />
• Evaluated results: Number of evaluated blood<br />
glucose results in the period selected.<br />
• BG test frequency: Average number of blood<br />
glucose tests per day for each day of the selected<br />
period. In addition, the statistical information also<br />
contains the value (in brackets) for those days only<br />
on which a test was performed at least once.<br />
• Mean BG (MBG): Mean value from all analysed<br />
results.<br />
• Standard deviation (SD): Standard deviation or<br />
variance of the analysed results.<br />
• SD/MBG: This value indicates the variation of the<br />
blood glucose levels with reference to the mean value.<br />
If the mean value is in the desired range, a ratio of less<br />
than 50 % (or better: 30 %) indicates a desirable low<br />
variation and thus a good metabolic control.<br />
• MBG (before/after meal): Mean value from all<br />
results which have been obtained before or after<br />
meals and have been flagged in the meter accordingly.<br />
Values are displayed only when appropriate<br />
information is stored in the meter.<br />
• High/low BG index: These figures represent the<br />
frequency and the resulting risk of blood glucose<br />
levels being too low or too high (see literary<br />
references on page 4-43). Figures should be as low as<br />
possible.<br />
<strong>Accu</strong>-<strong>Chek</strong> <strong>Smart</strong> <strong>Pix</strong> user's manual 4-17
Chapter 4, <strong>Accu</strong>-<strong>Chek</strong> Report<br />
Distribution<br />
For each time block, you will find a bar chart here which<br />
represents the percentages of levels above, within and below<br />
the target range. The eight consecutive time blocks are<br />
arranged next to each other. The right part of the bar chart<br />
(blue background) shows a summary of the corresponding<br />
information for the whole day.<br />
Below the bar chart, you can see the number of<br />
hypoglycemic situations (Hypos) that occurred for each time<br />
block along with the number (n) of test results obtained and<br />
evaluated for the respective time block.<br />
If the time blocks are defined in the meter, this information<br />
is used. If they are not, the time block settings in the<br />
<strong>Accu</strong>-<strong>Chek</strong> <strong>Smart</strong> <strong>Pix</strong> configuration are used.<br />
4-18 <strong>Accu</strong>-<strong>Chek</strong> <strong>Smart</strong> <strong>Pix</strong> user's manual
Chapter 4, <strong>Accu</strong>-<strong>Chek</strong> Report<br />
Logbook<br />
The logbook creates an overview of blood glucose results in<br />
table form. The table of values (sorted by date and time<br />
blocks) is created according to the date and time information<br />
of the blood glucose results. You can specify whether the<br />
table is sorted in ascending or descending order under<br />
settings (see page 2-12). The date range displayed is shown<br />
in the title of the table.<br />
At the bottom you will find statistical analyses of all the test<br />
results plotted. The number of tests, the blood glucose<br />
average and the standard deviation are determined for each<br />
time block. In addition the minimum and maximum results,<br />
the high/low BG index and the number of test results above<br />
(Hi) and below (Lo) the measuring range are displayed.<br />
If the meter transfers the blood glucose result information<br />
before meal or after meal , an advanced statistical<br />
analysis will appear. The eight time blocks defined are<br />
divided into four groups, each containing one meal and the<br />
period preceding and following the meal. Mean values and<br />
standard deviations are calculated separately (before/after<br />
meal) for each of these groups. The average change of the<br />
blood glucose test result for paired values is also calculated.<br />
Such a paired value is the result of a test being performed<br />
before the meal and a second test being performed after<br />
the meal and following the first test within a period of one<br />
to two hours.<br />
If the evaluated period contains blood glucose levels which<br />
are marked with the event User-defined, a separate statistic<br />
is calculated and displayed for these.<br />
<strong>Accu</strong>-<strong>Chek</strong> <strong>Smart</strong> <strong>Pix</strong> user's manual 4-19
Chapter 4, <strong>Accu</strong>-<strong>Chek</strong> Report<br />
If there are levels without any indication of date or time, they<br />
are also displayed on a separate list (sorted according to<br />
their order in the device memory). The level measured last is<br />
in the top left position. In such a case, the statistical analyses<br />
can only be displayed for all the levels because it is not<br />
possible to assign them to time blocks.<br />
4-20 <strong>Accu</strong>-<strong>Chek</strong> <strong>Smart</strong> <strong>Pix</strong> user's manual
Chapter 4, <strong>Accu</strong>-<strong>Chek</strong> Report<br />
Overview<br />
The report element “Overview” contains general and<br />
statistical information about the levels processed for the time<br />
range selected. Here you will find the following information<br />
(in the order shown here):<br />
Report title<br />
• Report period: Period (according to configuration)<br />
with the most recent date.<br />
• Meter(s) (symbol): Displays the meter used and its<br />
serial number. If you are using several meters (see<br />
page 2-13), the symbol is displayed with all read<br />
serial numbers.<br />
Report<br />
• Report period: Period (according to configuration)<br />
with the most recent date.<br />
• Evaluated results Number of evaluated blood<br />
glucose results in the period selected.<br />
• Maximum/Mean BG/Minimum: Highest and<br />
lowest blood glucose level which was measured in the<br />
period selected, and the average of all the levels<br />
measured.<br />
• SD: Standard deviation or variance of the analysed<br />
results.<br />
• BG Test Frequency: Average number of blood<br />
glucose tests per day for each day of the period<br />
selected. In addition, the statistical information also<br />
contains the value (in brackets) for those days only<br />
on which a test was performed at least once.<br />
• Target Range: The target range used for evaluation.<br />
<strong>Accu</strong>-<strong>Chek</strong> <strong>Smart</strong> <strong>Pix</strong> user's manual 4-21
Chapter 4, <strong>Accu</strong>-<strong>Chek</strong> Report<br />
• Hypo limit: Blood glucose levels below this threshold<br />
are marked as hypoglycemia.<br />
• High/low BG index: These figures represent the<br />
frequency and the resulting risk of blood glucose<br />
levels being too low or too high (see literary<br />
references on page 4-43). Figures should be as low<br />
as possible.<br />
• Hi/Lo: Number of test results above (Hi) and below<br />
(Lo) the measuring range.<br />
• Controls: Number of tests with control solution.<br />
Device:<br />
• Serial number: Serial number of the meter.<br />
• Date/Time: Time setting of the meter when the report<br />
is created.<br />
If you are using several meters, this information is repeated<br />
for each meter.<br />
• Stored Results: Total number of test results in the<br />
device(s), with timeframe details (from ... to).<br />
Additional information<br />
This information is only displayed if required:<br />
• Values without Date/Time: Number of test results<br />
which were stored without date or time information.<br />
• Values with warnings: Number of test results which<br />
were stored with temperature warning, expiry note,<br />
etc.<br />
4-22 <strong>Accu</strong>-<strong>Chek</strong> <strong>Smart</strong> <strong>Pix</strong> user's manual
Chapter 4, <strong>Accu</strong>-<strong>Chek</strong> Report<br />
Record List<br />
The record list shows the test results sorted by date and time<br />
of the test. You can specify whether this list is sorted in<br />
ascending or descending order under settings, (see<br />
page 2-12). All the blood glucose results are shown in<br />
chronological order together with additional information<br />
(events, insulin, etc.) The example opposite has been<br />
shortened.<br />
At the bottom you will find statistical analyses of all the test<br />
results plotted. The number of tests, the blood glucose<br />
average and the standard deviation are determined. In<br />
addition the minimum and maximum results, the high/low<br />
BG index and the number of test results above (Hi) and<br />
below (Lo) the measuring range are displayed.<br />
If the meter transfers the blood glucose result information<br />
before meal or after meal , an advanced statistical<br />
analysis will appear. Mean values and standard deviations<br />
are calculated separately for test results before and after<br />
meals. The average change of the blood glucose test result<br />
for paired values is also calculated. Such a paired value is the<br />
result of a test being performed before the meal and a<br />
second test being performed after the meal and following<br />
the first test within a period of one to two hours.<br />
If the evaluated period contains blood glucose levels which<br />
are marked with the event User-defined, a separate statistic<br />
is calculated and displayed for these.<br />
In addition, levels without date and time information as well<br />
as levels which were determined using control solution are<br />
each listed in separate statistics.<br />
<strong>Accu</strong>-<strong>Chek</strong> <strong>Smart</strong> <strong>Pix</strong> user's manual 4-23
Chapter 4, <strong>Accu</strong>-<strong>Chek</strong> Report<br />
4.4 <strong>Insulin</strong> pump: general information about the reports<br />
Types of report<br />
The <strong>Accu</strong>-<strong>Chek</strong> <strong>Smart</strong> <strong>Pix</strong> system creates single-page or<br />
multi-page reports for defined periods (e.g. the last 1 or<br />
2 weeks). The period has been defined in configuration.<br />
An (insulin pump) report can contain any of the following<br />
elements:<br />
[1] Trend Graph<br />
[2] Day Graph<br />
[3] Week Graph<br />
[4] Basal Rates<br />
[5] Basal Bolus<br />
[6] Long Term Overview<br />
[7] Lists (Bolus, Basal, Events)<br />
The illustration on the left shows examples of the printed<br />
version of the report.<br />
4-24 <strong>Accu</strong>-<strong>Chek</strong> <strong>Smart</strong> <strong>Pix</strong> user's manual
Chapter 4, <strong>Accu</strong>-<strong>Chek</strong> Report<br />
Graphic elements of the reports<br />
On all reports, you will find legends explaining the meaning<br />
of individual elements. Here are detailed explanations of the<br />
various elements.<br />
Symbols On the insulin pump reports, you will find the<br />
following symbols:<br />
Basal rates (represented in the Trend Graph)<br />
Mean total basal amount per day (Basal Bolus)<br />
Basal profile<br />
Changes to the basal rate (Basal Bolus)<br />
Changes to the basal rate (with designation, Trend Graph)<br />
Temporary increase in basal rate<br />
Temporary decrease in basal rate<br />
Active basal rate (Long Term Overview)<br />
Switch to a named basal profile (e.g. “A”)<br />
Switch from a named basal profile (e.g. “A”) to another<br />
named basal profile (e.g. “B”)<br />
<strong>Accu</strong>-<strong>Chek</strong> <strong>Smart</strong> <strong>Pix</strong> user's manual 4-25
Chapter 4, <strong>Accu</strong>-<strong>Chek</strong> Report<br />
Total of basal insulin + bolus insulin per day<br />
Standard bolus, represented in charts from the top<br />
downwards<br />
Scroll bolus, represented in charts from the top<br />
downwards<br />
Extended bolus, represented in charts from the top<br />
downwards ; the width of the bar shows the duration of<br />
the delivery<br />
Multiwave bolus, represented in charts from the top<br />
downwards ; the width of the bar shows the duration of<br />
the extended portion<br />
Bolus Advice; always appears in combination with one of the<br />
four bolus type symbols described above. These boluses<br />
have been calculated with a bolus calculator (from a<br />
respective meter). Bolus advice is only displayed if the bolus<br />
has been delivered and is thus stored in the pump.<br />
Prime infusion set<br />
Return of piston rod (cartridge change)<br />
<strong>Insulin</strong> pump run<br />
<strong>Insulin</strong> pump stop<br />
4-26 <strong>Accu</strong>-<strong>Chek</strong> <strong>Smart</strong> <strong>Pix</strong> user's manual
Chapter 4, <strong>Accu</strong>-<strong>Chek</strong> Report<br />
4.5 <strong>Insulin</strong> pump: content of the report<br />
Trend Graph<br />
This analysis shows the trend in insulin dosage over the time<br />
range selected. You will find the days and months along the<br />
horizontal (x) axis and the respective amounts of insulin<br />
delivered along the vertical (y) axis.<br />
The basal rate chart is at the bottom, and the individual<br />
boluses are shown at the top. Therefore, you will find the<br />
basal rate scale along the left-hand y-axis (from the bottom<br />
upwards) and the scale for the boluses along the right-hand<br />
y-axis (from the top downwards).<br />
In addition to the actual insulin dose, various events are also<br />
shown. These are:<br />
• Pump events (in this case: black symbols on the chart)<br />
• Switch of basal profile (in this case: blue “flag”<br />
symbolises a switch to basal profile 1)<br />
• Changes in basal rate (in this case: basal profile 3)<br />
You will find the meanings of the various symbols in brief in<br />
the legend and in detail on page 4-25.<br />
As in the blood glucose analysis, the days that are usually<br />
non-working days (weekends) are marked with an additional<br />
green bar on the horizontal axis.<br />
<strong>Accu</strong>-<strong>Chek</strong> <strong>Smart</strong> <strong>Pix</strong> user's manual 4-27
Chapter 4, <strong>Accu</strong>-<strong>Chek</strong> Report<br />
Day Graph<br />
This analysis is used (as with blood glucose) to make it easier<br />
to recognise and display patterns repeated daily. For this<br />
purpose, all data is placed on a 24-hour grid. This allows you<br />
to easily recognise frequent manual basal rate changes at<br />
certain times, for example, thus it would be easier to<br />
generally adjust the basal rate.<br />
The mean basal rate is displayed as a blue filled-in area,<br />
while the maximum and minimum basal rate at the<br />
respective time of day is shown as a thin blue line.<br />
On this chart, you will find not only basal rates and boluses<br />
but also information about the start and stop of the insulin<br />
pump and about temporary decreases and increases in the<br />
basal rate.<br />
Week Graph<br />
This analysis is also used (as with the Day Graph) to make it<br />
easier to recognise repeated patterns (e.g. repeated basal<br />
rate changes), but in this case it depends on the day of the<br />
week.<br />
On this chart, you will find not only basal rates and boluses<br />
but also information about basal rate changes and the<br />
selection of basal profiles.<br />
4-28 <strong>Accu</strong>-<strong>Chek</strong> <strong>Smart</strong> <strong>Pix</strong> user's manual
Chapter 4, <strong>Accu</strong>-<strong>Chek</strong> Report<br />
Basal Rates<br />
This analysis displays the basal rates set in the insulin pump<br />
at the time of data transfer in order to facilitate comparison.<br />
The currently active basal profile can be identified by the<br />
thicker dark blue line. The total daily amounts of the<br />
respective profiles are indicated below the chart, and the<br />
active basal profile is highlighted.<br />
You can change this view to obtain a table view of the basal<br />
rates.<br />
• Click directly on the graphic view of the basal rates to<br />
switch to the table view.<br />
• Click directly on the table view of the basal rate to<br />
switch back to the graphic view.<br />
The table view contains the specified amount of insulin per<br />
hour as a numeric value in a 24-hour grid. If the insulin pump<br />
allows several basal profiles to be defined, these are<br />
displayed below each other. The active basal profile is<br />
highlighted.<br />
If you want to print the table view, click on the Print Page<br />
button. Unlike the graphic view, the table view cannot be<br />
selected and printed via the Create Report function (see<br />
page 4-2).<br />
<strong>Accu</strong>-<strong>Chek</strong> <strong>Smart</strong> <strong>Pix</strong> user's manual 4-29
Chapter 4, <strong>Accu</strong>-<strong>Chek</strong> Report<br />
Basal Bolus<br />
The Basal Bolus analysis in table form shows the (absolute<br />
and relative) frequency with which, for example, a certain<br />
basal profile or a certain bolus type was used.<br />
Basal<br />
Here you can see, for example, how often the basal rate of a<br />
certain basal profile was temporarily increased or decreased<br />
and for how long that changed state was valid (as a percentage).<br />
Frequent changes and/or long use times with manually<br />
changed basal rates might make it advisable to perform<br />
a general adjustment.<br />
The number of times the basal rate has been reprogrammed<br />
is displayed in the last column. For the sake of completeness,<br />
the Basal table also includes the times when the insulin<br />
pump was in STOP.<br />
Bolus<br />
This table shows both the (relative) frequency of use with<br />
regard to certain types of bolus and their average number<br />
per day. The proportion of boluses which have been<br />
delivered using bolus advice is represented in a different<br />
colour (orange).<br />
Means per day<br />
Here you will find the basal and bolus means and their<br />
percentage of the total amount.<br />
4-30 <strong>Accu</strong>-<strong>Chek</strong> <strong>Smart</strong> <strong>Pix</strong> user's manual
Chapter 4, <strong>Accu</strong>-<strong>Chek</strong> Report<br />
Long Term Overview<br />
The Long Term Overview report element contains general and<br />
statistical information about the figures imported. The time<br />
range of this analysis may be different from that of other<br />
analyses because longer periods (up to 12 weeks) are<br />
analysed. Here you will find the following information (in the<br />
order shown here):<br />
Report title<br />
• Report period: Period (according to configuration)<br />
with the most recent date.<br />
• <strong>Insulin</strong> pump (symbol): Displays the insulin pump<br />
used and its serial number.<br />
Device:<br />
• Serial number: Serial number of the insulin pump.<br />
• Date/Time: Date and time on the insulin pump at the<br />
time of data transfer.<br />
• Remaining Use Time: Remaining time of use for this<br />
insulin pump.<br />
• BR Profile Selections: The frequency (per week)<br />
with which the insulin pump was switched over to<br />
a different basal profile.<br />
• Time and Date Settings: The time and date<br />
information was re-entered this number of times (e.g.<br />
on account of summer time, transcontinental flights,<br />
etc.)<br />
The table shows the percentage of certain basal profiles<br />
(and times when the insulin pump was in STOP). The<br />
currently active basal profile is marked with a tick .<br />
Additional information<br />
This information contains error messages and warnings (and<br />
their number) which were stored in the insulin pump.<br />
<strong>Accu</strong>-<strong>Chek</strong> <strong>Smart</strong> <strong>Pix</strong> user's manual 4-31
Chapter 4, <strong>Accu</strong>-<strong>Chek</strong> Report<br />
Lists<br />
The three groups of information, Bolus, Basal and Events are<br />
also output in the form of lists. You can specify whether this<br />
list is sorted in ascending or descending order under<br />
settings, (see page 2-12). On these lists, you will find detailed<br />
documentation of each individual event stored in the insulin<br />
pump, including date and time. Boluses which have been<br />
delivered using bolus advice are flagged with the<br />
corresponding symbol .<br />
To see all the lists, please use the scroll bar on the right-hand<br />
side. The examples opposite have been shortened.<br />
4-32 <strong>Accu</strong>-<strong>Chek</strong> <strong>Smart</strong> <strong>Pix</strong> user's manual
Chapter 4, <strong>Accu</strong>-<strong>Chek</strong> Report<br />
4.6 Blood glucose and insulin pump: combined report<br />
If you analyse data from a blood glucose meter together with<br />
data from an insulin pump, combined analyses of the<br />
simultaneously obtained information can provide useful<br />
indications for therapy. In addition to the individual blood<br />
glucose and insulin pump analyses a combined report is<br />
therefore available.<br />
i<br />
If you want to analyse the data of several devices<br />
together, the devices must be synchronized, i.e. all<br />
devices involved should have the same date and time<br />
settings. Deviations of ± 5 minutes maximum are<br />
tolerated; if the deviation is greater, no combined<br />
reports are created.<br />
<strong>Accu</strong>-<strong>Chek</strong> <strong>Smart</strong> <strong>Pix</strong> user's manual 4-33
Chapter 4, <strong>Accu</strong>-<strong>Chek</strong> Report<br />
Types of report<br />
The <strong>Accu</strong>-<strong>Chek</strong> <strong>Smart</strong> <strong>Pix</strong> system creates single-page or<br />
multi-page reports for defined periods (e.g. the last 2 or<br />
4 weeks). The period of the combined report is the shortest<br />
relevant period set for the blood glucose or insulin pump<br />
reports. The blood glucose levels are always displayed in the<br />
Detailed style, irrespective of the selected setting for the<br />
individual blood glucose report. A combined report can<br />
contain any of the following elements:<br />
[1] Trend Graph<br />
[2] Day Graph<br />
[3] Week Graph<br />
[4] Overview<br />
[5] Record List<br />
The illustration on the left shows examples of the printed<br />
version of the report.<br />
Graphic elements of the reports<br />
On all reports, you will find legends explaining the meaning<br />
of individual elements. For detailed explanations of the<br />
various elements, see the preceding descriptions of the<br />
blood glucose and insulin pump reports on page 4-8 and<br />
page 4-25.<br />
4-34 <strong>Accu</strong>-<strong>Chek</strong> <strong>Smart</strong> <strong>Pix</strong> user's manual
Chapter 4, <strong>Accu</strong>-<strong>Chek</strong> Report<br />
Trend Graph<br />
This analysis shows you the trend in test results and insulin<br />
pump data over the time range selected. You will find the<br />
days and months along the horizontal (x) axis and the<br />
respective blood glucose levels determined along the vertical<br />
(y) axis. This is also where you will find a display of insulin<br />
doses (bolus insulin and basal rate). Delivered bolus insulin<br />
amounts are plotted in the chart from the top downwards;<br />
the basal rate (blue curve) is displayed in the lower section of<br />
the chart. The related values can be seen on the right-hand<br />
y-axis (blue, from the bottom upwards = basal rate; and red,<br />
from the top downwards = bolus insulin dose).<br />
This representation does not display the mean blood glucose<br />
level and the pump events. If required, you can find this<br />
information in the individual reports as described on<br />
page 4-10 and page 4-27.<br />
Day Graph<br />
As with the individual reports, this view makes it easier to<br />
identify patterns that repeat on a daily basis. Here, too, all<br />
data is placed in a 24-hour-grid, making it easier to see the<br />
connection between insulin doses (bolus and basal) and<br />
measured blood glucose levels in relation to the time of day.<br />
All the information is plotted at the relevant time of day<br />
according to the time when the test was performed.<br />
The elements used in the display correspond to those in the<br />
Trend Graph report.<br />
<strong>Accu</strong>-<strong>Chek</strong> <strong>Smart</strong> <strong>Pix</strong> user's manual 4-35
Chapter 4, <strong>Accu</strong>-<strong>Chek</strong> Report<br />
Week Graph<br />
This analysis is also used to make it easier to recognise<br />
repeated patterns, but in this case depends on the day of the<br />
week. All the information is plotted on the chart according to<br />
the time the test was performed and the respective day of<br />
the week.<br />
The elements used in the display correspond to those in the<br />
Trend Graph report.<br />
Overview<br />
The report element “Overview” contains general and<br />
statistical information about the levels processed for the time<br />
range selected. Here you will find the following information<br />
(in the order shown here):<br />
Report title<br />
• Report period: Period (according to configuration)<br />
with the most recent date.<br />
• Meter/<strong>Insulin</strong> pump (symbols): Displays the meter<br />
and the insulin pump used. If you are using several<br />
meters (see page 2-13), the symbol is displayed<br />
next to the insulin pump.<br />
4-36 <strong>Accu</strong>-<strong>Chek</strong> <strong>Smart</strong> <strong>Pix</strong> user's manual
Chapter 4, <strong>Accu</strong>-<strong>Chek</strong> Report<br />
Device:<br />
• Serial number: Serial number of the meter or insulin<br />
pump.<br />
• Date/Time: Time setting of the meter and the insulin<br />
pump when the report is created.<br />
Possible deviations of the meter time from the insulin pump<br />
time are displayed after the meter time. The information<br />
“(-00:04)”, for example, means that the meter time is slow by<br />
4 minutes compared to the insulin pump time.<br />
If you are using several meters, this information is repeated<br />
for each meter.<br />
• Stored Results: Total number of test results in the<br />
device(s), with timeframe details (from ... to).<br />
<strong>Accu</strong>-<strong>Chek</strong> <strong>Smart</strong> <strong>Pix</strong> user's manual 4-37
Chapter 4, <strong>Accu</strong>-<strong>Chek</strong> Report<br />
Report (meters)<br />
• Evaluated results Number of evaluated blood<br />
glucose results in the period selected.<br />
• Maximum/Mean BG/Minimum: Highest and<br />
lowest blood glucose level which was measured in the<br />
period selected, and the average of all the levels<br />
measured.<br />
• SD: Standard deviation or variance of the analysed<br />
results.<br />
• BG Test Frequency: Average number of blood<br />
glucose tests per day for each day of the period<br />
selected. In addition, the statistical information also<br />
contains the value (in brackets) for those days only<br />
on which a test was performed at least once.<br />
• Target Range: The target range used for evaluation.<br />
• Hypo limit: Blood glucose levels below this threshold<br />
are marked as hypoglycemia.<br />
• High/low BG index: These figures represent the<br />
frequency and the resulting risk of blood glucose<br />
levels being too low or too high. Figures should be as<br />
low as possible.<br />
Additional information<br />
This information is only displayed if required.<br />
4-38 <strong>Accu</strong>-<strong>Chek</strong> <strong>Smart</strong> <strong>Pix</strong> user's manual
Chapter 4, <strong>Accu</strong>-<strong>Chek</strong> Report<br />
Report (insulin pump)<br />
• Boluses: Number of respective deliveries, according<br />
to bolus type.<br />
• Maximum/Mean BG/Minimum: Highest and<br />
lowest single insulin dose delivered in the selected<br />
period and the average of all insulin amounts<br />
delivered.<br />
• Number of boluses/Day: Average frequency of<br />
insulin doses per day (combined without considering<br />
the bolus type).<br />
• Changes to basal rates: Number of manual<br />
increases and decreases of the basal rate as well as<br />
the number of changes to and switches of the basal<br />
profile.<br />
<strong>Accu</strong>-<strong>Chek</strong> <strong>Smart</strong> <strong>Pix</strong> user's manual 4-39
Chapter 4, <strong>Accu</strong>-<strong>Chek</strong> Report<br />
Record List<br />
The combined record list shows the test results and insulin<br />
pump information, sorted by date and time. You can specify<br />
whether this list is sorted in ascending or descending order<br />
under settings, (see page 2-12). All the blood glucose results<br />
are shown in chronological order together with any recorded<br />
carbohydrate and insulin pump information. The example<br />
opposite has been shortened.<br />
Blood glucose and insulin pump information that is<br />
chronologically close is highlighted with a yellow<br />
background. This makes it easier to identify insulin doses<br />
that were delivered in direct relation to blood glucose tests.<br />
Boluses which have been delivered using bolus advice are<br />
flagged with the corresponding symbol .<br />
4-40 <strong>Accu</strong>-<strong>Chek</strong> <strong>Smart</strong> <strong>Pix</strong> user's manual
Chapter 4, <strong>Accu</strong>-<strong>Chek</strong> Report<br />
4.7 Analysing data in external applications<br />
You can also open and evaluate data read from meters and<br />
insulin pumps in other applications. Whenever data is<br />
transferred, XML files are also created in addition to the<br />
graphical and tabular analyses (for blood glucose meters<br />
and insulin pumps separately, including related XSL style<br />
sheets for formatting purposes). These files can be read by<br />
other suitable applications.<br />
The following example shows how to import an XML file into<br />
Microsoft Excel (as from version 2002).<br />
• Start Microsoft Excel and choose the command File ><br />
Open.<br />
• In the file selection dialogue, navigate to the <strong>Smart</strong><strong>Pix</strong><br />
drive and from there go to the REPORT / XML folder<br />
to display the contents saved there. If no file is<br />
displayed there, you must first select the file type<br />
“XML” in the file selection dialogue, if not already<br />
done.<br />
If you have read in data from a meter as well as an insulin<br />
pump, you will find two XML files. The first letter of the file<br />
name indicates what data is contained:<br />
– Gxxxxxxx.XML: glucose results from meter<br />
– Ixxxxxxx.XML: data from insulin pump<br />
• Select the desired file and click Open.<br />
<strong>Accu</strong>-<strong>Chek</strong> <strong>Smart</strong> <strong>Pix</strong> user's manual 4-41
Chapter 4, <strong>Accu</strong>-<strong>Chek</strong> Report<br />
• In the following dialogue box, select to import the<br />
XML data using the related style sheet. This additional<br />
file prepares and formats the data records in a legible<br />
way.<br />
Be careful to select the correct style sheet for the chosen<br />
XML file:<br />
• ACSPIXMT.XSL<br />
is the style sheet for meter data (MT = meter).<br />
• ACSPIXIP.XSL<br />
is the style sheet for insulin pump data (IP = insulin<br />
pump).<br />
The meter data read from the XML file is now represented in<br />
table form. Besides the tabular listing, you will also find<br />
statistical analyses at the end of the table.<br />
You can now save this file for archiving or other purposes on<br />
your hard drive. You cannot save this file on the <strong>Smart</strong><strong>Pix</strong><br />
removable disk.<br />
4-42 <strong>Accu</strong>-<strong>Chek</strong> <strong>Smart</strong> <strong>Pix</strong> user's manual
Chapter 4, <strong>Accu</strong>-<strong>Chek</strong> Report<br />
4.8 Literary references for reports<br />
Low/High BG Index<br />
Kovatchev BP, Cox DJ, Gonder-Frederick LA, Clarke WL<br />
(1997)<br />
Symmetrization of the blood glucose measurement scale and<br />
its applications. Diabetes Care, 20, pp 1655-1658<br />
Kovatchev BP, Cox DJ, Gonder-Frederick LA, Young-Hyman<br />
D, Schlundt D and Clarke WL (1998)<br />
Assessment of Risk for Severe Hypoglycemia Among Adults<br />
with IDDM: Validation of the Low Blood Glucose Index.<br />
Diabetes Care, 21, pp 1870-1875<br />
Kovatchev BP, Straume M, Cox DJ, Farhi LS (2001)<br />
Risk Analysis of Blood Glucose Data: A Quantitative<br />
Approach to Optimizing the Control of <strong>Insulin</strong> Dependent<br />
Diabetes. J of Theoretical Medicine, 3: pp 1-10.<br />
Kovatchev BP, Cox DJ, Gonder-Frederick LA and WL Clarke<br />
(2002)<br />
Methods for quantifying self-monitoring blood glucose<br />
profiles exemplified by an examination of blood glucose<br />
patterns in patients with Type 1 and Type 2 Diabetes.<br />
Diabetes Technology and Therapeutics, 4 (3): pp 295-303.<br />
<strong>Accu</strong>-<strong>Chek</strong> <strong>Smart</strong> <strong>Pix</strong> user's manual 4-43
Chapter 4, <strong>Accu</strong>-<strong>Chek</strong> Report<br />
4-44 <strong>Accu</strong>-<strong>Chek</strong> <strong>Smart</strong> <strong>Pix</strong> user's manual
Chapter 5, Error signals and troubleshooting<br />
5 Error signals and troubleshooting<br />
Sometimes situations can occur in which a report is not<br />
created or printed, or other problems arise. If you do not find<br />
the required solution here, please contact your local Roche<br />
representative.<br />
5.1 Errors without error signals<br />
The <strong>Accu</strong>-<strong>Chek</strong> <strong>Smart</strong> <strong>Pix</strong> system fails to appear on the PC as<br />
a drive:<br />
• Check whether your PC and your operating system<br />
meet the system requirements for the <strong>Accu</strong>-<strong>Chek</strong><br />
<strong>Smart</strong> <strong>Pix</strong> system (see page 2-1).<br />
• Check to make sure the USB connector is firmly<br />
plugged into the correct socket on the PC.<br />
• If the <strong>Accu</strong>-<strong>Chek</strong> <strong>Smart</strong> <strong>Pix</strong> system is still not<br />
recognised as a drive, plug the device into a different<br />
USB socket on your PC (you may be able to use a USB<br />
hub or choose between USB sockets on the front and<br />
rear of your PC).<br />
If the <strong>Accu</strong>-<strong>Chek</strong> <strong>Smart</strong> <strong>Pix</strong> system fails to emit any status<br />
indicator signals whatsoever and if all the above tests have<br />
been performed unsuccessfully, you could possibly test the<br />
device on a different PC. If there is still no sign of operation,<br />
the device is probably faulty. This also applies if there are<br />
error signals (centre of the status indicator flashing) which<br />
are not associated with data transfer. Please contact your<br />
local Roche representative.<br />
<strong>Accu</strong>-<strong>Chek</strong> <strong>Smart</strong> <strong>Pix</strong> user's manual 5-1
Chapter 5, Error signals and troubleshooting<br />
5.2 Error signals on the device<br />
8<br />
The <strong>Accu</strong>-<strong>Chek</strong> <strong>Smart</strong> <strong>Pix</strong> system reports potential errors<br />
(e.g. during data transfer) by causing the centre of the status<br />
indicator 8 to flash.<br />
If such an error occurs, the following options are available to<br />
solve the problem:<br />
• In the browser user interface, click on the Read Device<br />
button. By flashing slowly again, the centre of the<br />
status indicator should now indicate that it is actively<br />
searching for devices and that it is ready for data<br />
transfer.<br />
• If the error signal continues, you can unplug the<br />
<strong>Accu</strong>-<strong>Chek</strong> <strong>Smart</strong> <strong>Pix</strong> system and plug it back in again.<br />
Any Microsoft Windows error message about<br />
removing the disk is of no further consequence.<br />
Then repeat data transfer.<br />
If this error signal occurs again, check the following points:<br />
• Has the meter been properly prepared for data<br />
transfer For relevant information, see Chapter 3.<br />
• Is the optical contact (infrared port) unimpaired Is<br />
the distance correct (too far away)<br />
• Is there any interference from extraneous light<br />
(sunlight, another infrared port, fluorescent tubes or<br />
energy-saving lamps)<br />
In the event of error messages associated with data transfer,<br />
it is not the <strong>Accu</strong>-<strong>Chek</strong> <strong>Smart</strong> <strong>Pix</strong> system which is faulty –<br />
there is interference with data transfer between the devices.<br />
In individual cases, this may be due to the meter or insulin<br />
pump.<br />
5-2 <strong>Accu</strong>-<strong>Chek</strong> <strong>Smart</strong> <strong>Pix</strong> user's manual
Chapter 6, Maintenance<br />
6 Maintenance<br />
6.1 Cleaning the <strong>Accu</strong>-<strong>Chek</strong> <strong>Smart</strong> <strong>Pix</strong> system<br />
Unplug the <strong>Accu</strong>-<strong>Chek</strong> <strong>Smart</strong> <strong>Pix</strong> device before cleaning it.<br />
Use cloths slightly moistened with cleaning fluid and make<br />
sure no liquid gets inside the device.<br />
Clinical staff: Please observe the regulations applicable at<br />
your institution concerning protection against infection.<br />
6.2 Disposal<br />
The product itself may come into contact with blood during<br />
testing. Used products therefore carry a risk of infection.<br />
Please dispose of used products according to the regulations<br />
applicable in your country. For information about correct<br />
disposal, please contact your local council or authority. The<br />
product falls outside the scope of the European Directive<br />
2002/96/EC (Directive on waste electrical and electronic<br />
equipment).<br />
<strong>Accu</strong>-<strong>Chek</strong> <strong>Smart</strong> <strong>Pix</strong> user's manual 6-1
Chapter 6, Maintenance<br />
6-2 <strong>Accu</strong>-<strong>Chek</strong> <strong>Smart</strong> <strong>Pix</strong> user's manual
Chapter 7, Appendix<br />
7 Appendix<br />
7.1 Abbreviations<br />
BG<br />
MBG<br />
SD<br />
AST<br />
BR<br />
TBR<br />
IR<br />
Hi<br />
Lo<br />
Hypo<br />
U<br />
U/h<br />
Blood glucose<br />
Mean blood glucose level<br />
Standard deviation<br />
Alternative site testing<br />
Basal rate<br />
Temporary basal rate<br />
Infrared<br />
Result above the measuring range (indicated on the meter as HI)<br />
Result below the measuring range (indicated on the meter as LO)<br />
Hypoglycemia<br />
<strong>Insulin</strong> dose in International Units<br />
<strong>Insulin</strong> dose delivered per hour (basal rate)<br />
7.2 Technical data<br />
Meter type<br />
<strong>Accu</strong>-<strong>Chek</strong> <strong>Smart</strong> <strong>Pix</strong><br />
Catalogue number 0 4684206001<br />
Serial number<br />
See type plate on the back of the device<br />
Dimensions<br />
104 x 74 x 38 mm<br />
Weight<br />
90 g<br />
Status indicator<br />
6 blue LEDs, in groups of 2 each<br />
Power supply<br />
Via USB port, 5 V/100 mA<br />
Protection class<br />
Equipment in protection class III<br />
Ports<br />
1 infrared port<br />
1 USB port<br />
Ambient conditions Operation temperature range: 5°C – 40°C<br />
Storage temperature range: -25°C – 70°C<br />
Absolute humidity: 5 g/m 3 – 25 g/m 3<br />
<strong>Accu</strong>-<strong>Chek</strong> <strong>Smart</strong> <strong>Pix</strong> user's manual 7-1
Chapter 7, Appendix<br />
7.3 Information about advice and the repair service<br />
Advice: If you have any questions on handling the device<br />
or if you suspect that the device is faulty, please contact your<br />
local Roche representative.<br />
Repair service: Please bear in mind that any repairs,<br />
configurations or other changes to the <strong>Accu</strong>-<strong>Chek</strong> <strong>Smart</strong> <strong>Pix</strong><br />
device may only be performed by persons who have been<br />
authorised to do so by Roche Diagnostics. If you suspect that<br />
the device is faulty, please contact your local Roche<br />
representative.<br />
7-2 <strong>Accu</strong>-<strong>Chek</strong> <strong>Smart</strong> <strong>Pix</strong> user's manual
Chapter 7, Appendix<br />
7.4 Roche Diagnostics addresses<br />
Country Company Address<br />
Australia Roche Diagnostics Australia Pty Ltd. Roche Diagnostics Australia Pty Ltd.<br />
ABN 29 003 001 205<br />
31 Victoria Ave<br />
Castle Hill, NSW, 2154, Australia<br />
<strong>Accu</strong>-<strong>Chek</strong> Enquiry line: 1800 251816<br />
Austria Roche Diagnostics GmbH Roche Diagnostics GmbH<br />
Engelhorngasse 3, 1211 Wien, Österreich<br />
<strong>Accu</strong>-<strong>Chek</strong> Kunden Service Center: (01) 277 87-355<br />
Belgium Roche Diagnostics Belgium SA/NV Roche Diagnostics Belgium SA/NV<br />
Schaarbeeklei 198, 1800 Vilvoorde, België<br />
Tel: 0800-93626 (<strong>Accu</strong>-<strong>Chek</strong> Service)<br />
Bosnia and<br />
Herzegovina<br />
Roche Diagnostics<br />
Promotional Office Adriatic Region<br />
Roche Diagnostics, P.O. Adriatic Region<br />
C/O Farmavita d.o.o.<br />
Despićeva 1<br />
71 000 Sarajevo, Bosnia and Herzegovina<br />
Tel.: + 387 33 712 690, Fax: + 387 33 712 692<br />
Brazil Roche Diagnóstica Brasil Ltda. Roche Diagnóstica Brasil Ltda.<br />
Av. Engenheiro Billings, 1729<br />
05321-010 São Paulo, SP, Brasil<br />
<strong>Accu</strong>-<strong>Chek</strong> Responde: 0800 77 20 126<br />
Bulgaria Marvena МАРВЕНА ООД<br />
1799 София<br />
ж.к. „Младост 2”<br />
ул: „Св.Киприан” 44<br />
Тел. 9 44 18 55<br />
Canada Roche Diagnostics Roche Diagnostics,<br />
201 Boul. Armand-Frappier,<br />
Laval, Québec, H7V 4A2, Canada<br />
<strong>Accu</strong>-<strong>Chek</strong> Customer Care: 1-800-363-7949<br />
China Roche Diagnostics (Shanghai) Limited 1045 10 200031<br />
800-810-0733<br />
<strong>Accu</strong>-<strong>Chek</strong> <strong>Smart</strong> <strong>Pix</strong> user's manual 7-3
Chapter 7, Appendix<br />
Country Company Address<br />
Croatia<br />
Roche Diagnostics<br />
Promotional Office Adriatic Region<br />
Roche Diagnostics, Promotional Office Adriatic<br />
Banjavčićeva 22/II,<br />
10000 Zagreb, Hrvatska<br />
Besplatna telefonska linija: 0800 60 00 60<br />
Czech Republic Roche s.r.o., Diagnostics Division Roche s.r.o. Diagnostic divison<br />
Prodejní jednotka Diabetes Care<br />
Dukelských hrdinů 12<br />
170 00 Praha 7, Česká Republika<br />
Informace o glukometrech na bezplatné lince 800 111 800<br />
Denmark Roche Diagnostics A/S Roche Diagnostics A/S<br />
Industriholmen 59, 2650 Hvidovre, Danmark<br />
Tlf. 36 39 99 54<br />
Finland Roche Diagnostics Oy Roche Diagnostics Oy<br />
PL 160<br />
02181 Espoo, Suomi<br />
Puh. 010 554 511<br />
Asiakaspalvelupuhelin: 0800 92066 (maksuton)<br />
France Roche Diagnostics Roche Diagnostics,<br />
2, Avenue du Vercors, B.P. 59<br />
38242 Meylan Cedex, France<br />
Numéro vert : 0 800 27 26 93<br />
Germany Roche Diagnostics GmbH Roche Diagnostics Deutschland GmbH<br />
Sandhofer Strasse 116<br />
68305 Mannheim, Deutschland<br />
<strong>Accu</strong>-<strong>Chek</strong> Kunden Service Center<br />
Telefon: 0180/2 00 08 13<br />
Greece<br />
Hong Kong,<br />
New Territories<br />
Roche (Hellas) S.A.<br />
Diagnostics Division<br />
Roche Diagnostics (Hong Kong) Ltd.<br />
Roche Diagnostics (Hellas) A.E.Diabetes Care<br />
Αλ. Παναγούλη 91, 142 34 Νέα Ιωνία Αττικής, Ελλάδα<br />
Τηλ. 210 2703700<br />
Γραμμή Εξυπηρέτησης Διαβήτη 800 11 71000<br />
Roche Diagnostics (Hong Kong) Ltd.<br />
1316-1325 Metroplaza, Tower 1<br />
223 Hing Fong Road<br />
Kwai Chung, Hong Kong<br />
Enquiry hotline : 852 2485 7512<br />
7-4 <strong>Accu</strong>-<strong>Chek</strong> <strong>Smart</strong> <strong>Pix</strong> user's manual
Chapter 7, Appendix<br />
Country Company Address<br />
Hungary Roche Magyarország Kft. Roche Magyarország Kft.,<br />
2040 Budaörs, Edison u. 1, Magyarország<br />
Ingyenesen hívható szám: 06-80-200-694<br />
Israel Dyn Diagnostics Ltd. Dyn Diagnostics Ltd.<br />
7 Ha’Eshel St.<br />
Caesarea Industrial Park<br />
Tel. 972-4-6277090<br />
Italy Roche Diagnostics S.p.A Roche Diagnostics S.p.A<br />
Viale G. B. Stucchi 110, 20052 Monza (MI), Italia<br />
Numero Verde: 800-822189<br />
Japan Roche Diagnostics K.K. Roche Diagnostics K.K.<br />
DC Product Department<br />
5F Nippon Roche Building<br />
6-1, Shiba 2-chome, Minato-ku,<br />
Tokyo 105-0041, Japan<br />
Tel. +81-3-5443-7044<br />
Fax. +81-3-5445-1297<br />
Netherlands Roche Diagnostics Nederland BV Roche Diagnostics Nederland BV<br />
Transistorstraat 41, 1322 CK Almere, Nederland<br />
Tel. 0800-0220585 (<strong>Accu</strong>-<strong>Chek</strong> Diabetes Service)<br />
New Zealand Roche Diagnostics N.Z. Ltd Roche Diagnostics N.Z. Ltd<br />
15 Rakino Way, Box 62-089<br />
Mt. Wellington, Auckland, New Zealand<br />
<strong>Accu</strong>-<strong>Chek</strong> Enquiry Line: 0800 80 22 99<br />
Norway Roche Diagnostics Norge AS Roche Diagnostics Norge AS<br />
Brynsengfaret 6B<br />
Pb 6610 Etterstad<br />
0607 Oslo, Norge<br />
Telefon kundestøtte + 47- 815 00 510<br />
Poland Roche Diagnostics Polska Sp. z o.o. Roche Diagnostics Polska Sp. z o.o.<br />
ul. Wybrzeże Gdyńskie 6 B<br />
01-531 Warszawa, Polska<br />
Bezpłatna infolinia 0-800 401 061<br />
Portugal Roche Sistemas de Diagnósticos, Lda. Roche Sistemas de Diagnósticos, Lda.<br />
Estrada Nacional 249-1<br />
2720-413 Amadora, Portugal<br />
Linha de Assistência a Clientes 800 200 265<br />
<strong>Accu</strong>-<strong>Chek</strong> <strong>Smart</strong> <strong>Pix</strong> user's manual 7-5
Chapter 7, Appendix<br />
Country Company Address<br />
Romania Roche Romania SRL B-dul Dimitie Pompeiu, nr.9-9A<br />
Cladirea 2 A, parter<br />
Sector 2, Bucuresti<br />
cod 020335<br />
Helpline 0800 080 228 (apel gratuit)<br />
Russia Roche Moscow Ltd. Россия ЗАО «Рош-Москва»<br />
отделение «Диабет», 107031 Москва, Бизнес-Центр «Неглинная<br />
Плаза», Трубная площадь, 2, Россия<br />
Информационный центр: 8-800-200-88-99 (звонок бесплатный для<br />
всех регионов России), (495) 258 27 89<br />
Singapore Roche Diagnostics Asia Pacific Pte. Ltd. Roche Diagnostics Asia Pacific Pte. Ltd<br />
298, Tiong Bahru Road<br />
# 16-01/06 Central Plaza<br />
Singapore 168730, Singapore<br />
Slovakia Roche Diagnostics Division Roche Slovensko, s.r.o.<br />
Diagnostics Division<br />
Lazaretská 8<br />
811 08 Bratislava 1<br />
Infolinka <strong>ACCU</strong>-<strong>CHEK</strong> 0800 120 200<br />
Slovenia Roche farmacevtska družba d.o.o. Dobavitelj:<br />
Roche farmacevtska družba d.o.o.<br />
Vodovodna cesta 109<br />
1000 Ljubljana, Slovenija<br />
South Africa<br />
Roche Products (Pty) Ltd. South Africa<br />
Diagnostics Division<br />
Center za pomoč uporabnikom in servis:<br />
Roche farmacevtska družba d.o.o.<br />
Divizija za diagnostiko<br />
Vodovodna cesta 109<br />
1000 Ljubljana, Slovenija<br />
Brezplačen telefon: 080 12 32<br />
Roche Products (Pty) Ltd. South Africa<br />
Diagnostics Division<br />
9, Will Scarlet Road / Ferndale<br />
P.O. Box 1927<br />
Randburg 2125 , South Africa<br />
<strong>Accu</strong>-<strong>Chek</strong> Care Line 080-DIABETES: dial 080-34-22-38-37<br />
7-6 <strong>Accu</strong>-<strong>Chek</strong> <strong>Smart</strong> <strong>Pix</strong> user's manual
Chapter 7, Appendix<br />
Country Company Address<br />
Spain Roche Diagnostics S.L. Roche Diagnostics S.L.<br />
Av. de la Generalitat, 171-173<br />
08174 Sant Cugat del Vallès (Barcelona), España<br />
Línea de atención al cliente: 900 210 341<br />
Sweden Roche Diagnostics Scandinavia AB Roche Diagnostics Scandinavia AB<br />
Box 147<br />
161 26 Bromma, Sverige<br />
<strong>Accu</strong>-<strong>Chek</strong> Kundsupport 020-41 00 42<br />
Switzerland Roche Diagnostics (Schweiz) AG Roche Diagnostics (Schweiz) AG<br />
Industriestr. 7<br />
6343 Rotkreuz<br />
Hotline Diabetes Service 0800 803 303<br />
Taiwan Roche Diagnostics Ltd. <br />
104 35 11 <br />
0800-060-333<br />
www.accu-chek.com.tw<br />
Turkey Roche Diagnostik Sistemleri Ticaret A.Ş. Roche Diagnostik Sistemleri Ticaret A.Ş.<br />
Gazeteciler Sitesi - Matbuat Sokak No. 3<br />
34394 Esentepe - Istanbul, Türkiye<br />
Ücretsiz Destek Hattı : 0-800-211 36 36<br />
United Kingdom Roche Diagnostics Ltd Roche Diagnostics Limited<br />
Charles Avenue, Burgess Hill<br />
West Sussex, RH15 9RY, United Kingdom<br />
<strong>Accu</strong>-<strong>Chek</strong> Customer Careline 1)<br />
UK Freephone number: 0800 701 000<br />
ROI Freephone number: 1 800 709 600<br />
1) calls may be recorded for training purposes<br />
USA Roche Diagnostics Roche Diagnostics<br />
9115 Hague Road, Indianapolis, IN 46256, USA<br />
<strong>Accu</strong>-<strong>Chek</strong> Customer Care Service Center: 1-800-858-8072<br />
<strong>Accu</strong>-<strong>Chek</strong> <strong>Smart</strong> <strong>Pix</strong> user's manual 7-7
<strong>ACCU</strong>-<strong>CHEK</strong>, <strong>ACCU</strong>-<strong>CHEK</strong> AVIVA, <strong>ACCU</strong>-<strong>CHEK</strong> AVIVA COMBO, <strong>ACCU</strong>-<strong>CHEK</strong> AVIVA NANO,<br />
<strong>ACCU</strong>-<strong>CHEK</strong> AVIVA EXPERT, <strong>ACCU</strong>-<strong>CHEK</strong> GO, <strong>ACCU</strong>-<strong>CHEK</strong> INTEGRA, <strong>ACCU</strong>-<strong>CHEK</strong> MOBILE,<br />
<strong>ACCU</strong>-<strong>CHEK</strong> PERFORMA, <strong>ACCU</strong>-<strong>CHEK</strong> SPIRIT, <strong>ACCU</strong>-<strong>CHEK</strong> SPIRIT COMBO, <strong>ACCU</strong>-<strong>CHEK</strong> SMART PIX,<br />
ADVANTAGE, CAMIT, COMBO, DISETRONIC, D-TRONPLUS, PERFORMA COMBO, PERFORMA EXPERT,<br />
PERFORMA NANO, VOICEMATE and LIVE LIFE. THE WAY YOU WANT. are trademarks of Roche.<br />
Roche Diagnostics GmbH<br />
Sandhofer Strasse 116<br />
68305 Mannheim, Germany<br />
www.accu-chek.com<br />
0 4684273001 (06) - 03/09 EN