Monograph - Metrohm
Monograph - Metrohm
Monograph - Metrohm

You also want an ePaper? Increase the reach of your titles
YUMPU automatically turns print PDFs into web optimized ePapers that Google loves.
Practical thermometric titrimetry 15<br />
Table 1: Relationship between anticipated titrant consumption and sensor data sampling rate.<br />
Anticipated titrant<br />
consumption, mL<br />
Data sampling<br />
rate, 1/sec<br />
Titrant addition<br />
rate, mL/min<br />
Data points<br />
collected<br />
0…3 25 1 0…4500<br />
3…7.5 10 1.5 1200…3000<br />
7.5…10 10 2 2250…3000<br />
5.1.4. Optimizing titration results with software<br />
The Titrotherm software employs a powerful data-smoothing algorithm that exhibits a<br />
minimum endpoint shift as a function of the degree of filtering applied. However, it is<br />
inevitable that some shift will occur. For highest accuracy and precision this shift should<br />
be taken into consideration. For thermometric titrations, endpoint shift appears to be less<br />
pronounced in titration reactions involving large enthalpy changes with fast reaction kinetics.<br />
For example, redox and strong acid/strong base titrations usually exhibit a minimal<br />
endpoint shift. Apart from these, some reactions may require more careful optimization.<br />
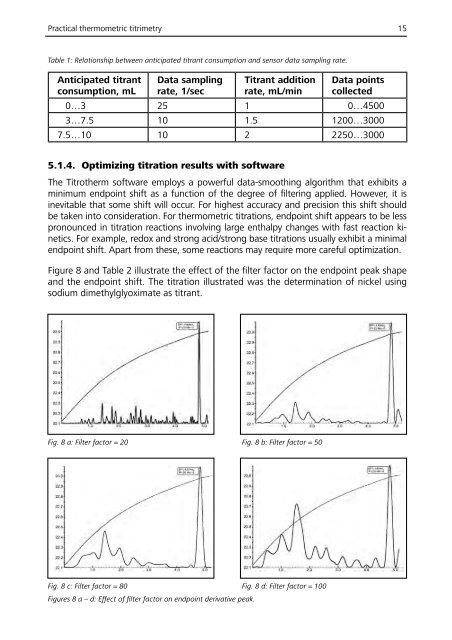
Figure 8 and Table 2 illustrate the effect of the filter factor on the endpoint peak shape<br />
and the endpoint shift. The titration illustrated was the determination of nickel using<br />
sodium dimethylglyoximate as titrant.<br />
Fig. 8 a: Filter factor = 20 Fig. 8 b: Filter factor = 50<br />
Fig. 8 c: Filter factor = 80 Fig. 8 d: Filter factor = 100<br />
Figures 8 a – d: Effect of filter factor on endpoint derivative peak.