Monograph - Metrohm
Monograph - Metrohm
Monograph - Metrohm

You also want an ePaper? Increase the reach of your titles
YUMPU automatically turns print PDFs into web optimized ePapers that Google loves.
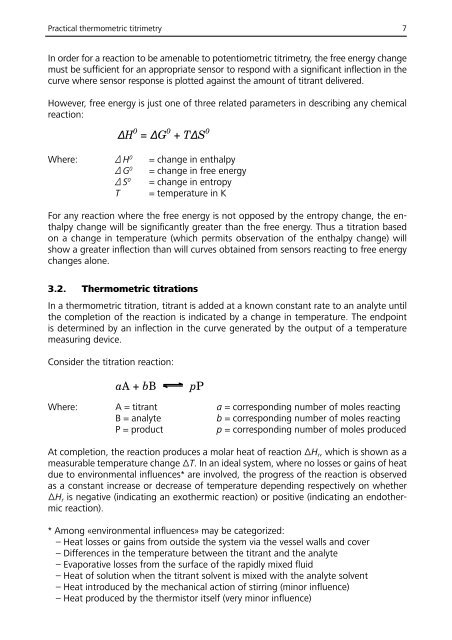
Practical thermometric titrimetry 7<br />
In order for a reaction Gto 0 be = amenable –R T lnK to potentiometric titrimetry, the free energy (1) change<br />
must be sufficient for an appropriate sensor to respond with a significant inflection in the<br />
curve where sensor G 0 response = –R is T plotted lnK against the amount of titrant delivered. (1)<br />
However, free energy is just one of three related parameters in describing any chemical<br />
reaction:<br />
Where:<br />
H 0 = G 0 + TS 0 (2)<br />
H 0 = G 0 + TS<br />
0 (2)<br />
Δ H 0 = change in enthalpy<br />
Δ G 0 = change in free energy<br />
Δ S 0 = change in entropy<br />
T<br />
= temperature in K<br />
For any reaction where Where: the free energy H 0 is not = change opposed by in enthalpy the entropy change, the enthalpy<br />
change will be significantly greater than the free energy. Thus a titration based<br />
on a change in Where: temperature (which H<br />
G 0 0 = change in free energy<br />
permits observation of the enthalpy change) will<br />
S 0 = change in enthalpy<br />
show a greater inflection than will Gcurves 0 = obtained change<br />
= change<br />
from in free<br />
in entropy<br />
sensors energy reacting to free energy<br />
changes alone.<br />
S<br />
T 0 = change<br />
= temperature<br />
in entropy<br />
in K<br />
T = temperature in K<br />
3.2. Thermometric titrations<br />
In a thermometric titration, titrant is added at a known constant rate to an analyte until<br />
the completion of the reaction is indicated by a change in temperature. The endpoint<br />
is determined by an inflection in the curve generated by the output of a temperature<br />
measuring device.<br />
Consider the titration reaction:<br />
aA + bB pP (3)<br />
aA + bB pP (3)<br />
Where: A = titrant a = corresponding number of moles reacting<br />
B = analyte<br />
b = corresponding number of moles reacting<br />
P = product<br />
p = corresponding number of moles produced<br />
At completion, the reaction produces a molar heat of reaction ΔH r , which is shown as a<br />
measurable temperature change ΔT. In an ideal system, where no losses or gains of heat<br />
due to environmental influences* are involved, the progress of the reaction is observed<br />
as a constant increase or decrease of temperature depending respectively on whether<br />
ΔH r is negative (indicating an exothermic reaction) or positive (indicating an endothermic<br />
reaction).<br />
* Among «environmental influences» may be categorized:<br />
– Heat losses or gains from outside the system via the vessel walls and cover<br />
– Differences in the temperature between the titrant and the analyte<br />
– Evaporative losses from the surface of the rapidly mixed fluid<br />
– Heat of solution when the titrant solvent is mixed with the analyte solvent<br />
– Heat introduced by the mechanical action of stirring (minor influence)<br />
– Heat produced by the thermistor itself (very minor influence)