Monograph - Metrohm
Monograph - Metrohm
Monograph - Metrohm

Create successful ePaper yourself
Turn your PDF publications into a flip-book with our unique Google optimized e-Paper software.
Practical thermometric titrimetry<br />
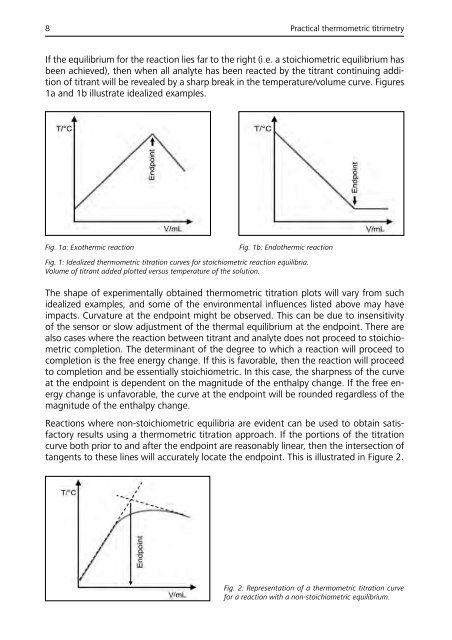
If the equilibrium for the reaction lies far to the right (i.e. a stoichiometric equilibrium has<br />
been achieved), then when all analyte has been reacted by the titrant continuing addition<br />
of titrant will be revealed by a sharp break in the temperature/volume curve. Figures<br />
1a and 1b illustrate idealized examples.<br />
Fig. 1a: Exothermic reaction<br />
Fig. 1b: Endothermic reaction<br />
Fig. 1: Idealized thermometric titration curves for stoichiometric reaction equilibria.<br />
Volume of titrant added plotted versus temperature of the solution.<br />
The shape of experimentally obtained thermometric titration plots will vary from such<br />
idealized examples, and some of the environmental influences listed above may have<br />
impacts. Curvature at the endpoint might be observed. This can be due to insensitivity<br />
of the sensor or slow adjustment of the thermal equilibrium at the endpoint. There are<br />
also cases where the reaction between titrant and analyte does not proceed to stoichiometric<br />
completion. The determinant of the degree to which a reaction will proceed to<br />
completion is the free energy change. If this is favorable, then the reaction will proceed<br />
to completion and be essentially stoichiometric. In this case, the sharpness of the curve<br />
at the endpoint is dependent on the magnitude of the enthalpy change. If the free energy<br />
change is unfavorable, the curve at the endpoint will be rounded regardless of the<br />
magnitude of the enthalpy change.<br />
Reactions where non-stoichiometric equilibria are evident can be used to obtain satisfactory<br />
results using a thermometric titration approach. If the portions of the titration<br />
curve both prior to and after the endpoint are reasonably linear, then the intersection of<br />
tangents to these lines will accurately locate the endpoint. This is illustrated in Figure 2.<br />
Fig. 2: Representation of a thermometric titration curve<br />
for a reaction with a non-stoichiometric equilibrium.