Monograph - Metrohm
Monograph - Metrohm
Monograph - Metrohm

You also want an ePaper? Increase the reach of your titles
YUMPU automatically turns print PDFs into web optimized ePapers that Google loves.
16 Practical thermometric titrimetry<br />
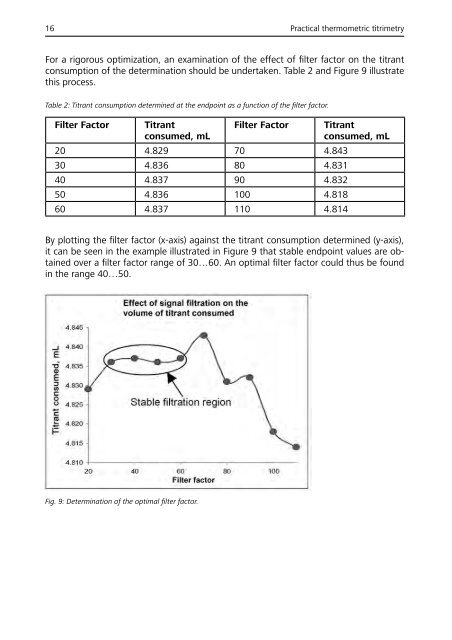
For a rigorous optimization, an examination of the effect of filter factor on the titrant<br />
consumption of the determination should be undertaken. Table 2 and Figure 9 illustrate<br />
this process.<br />
Table 2: Titrant consumption determined at the endpoint as a function of the filter factor.<br />
Filter Factor<br />
Titrant<br />
consumed, mL<br />
Filter Factor<br />
20 4.829 70 4.843<br />
30 4.836 80 4.831<br />
40 4.837 90 4.832<br />
50 4.836 100 4.818<br />
60 4.837 110 4.814<br />
Titrant<br />
consumed, mL<br />
By plotting the filter factor (x-axis) against the titrant consumption determined (y-axis),<br />
it can be seen in the example illustrated in Figure 9 that stable endpoint values are obtained<br />
over a filter factor range of 30…60. An optimal filter factor could thus be found<br />
in the range 40…50.<br />
Fig. 9: Determination of the optimal filter factor.