NATIONAL LABOR RELATIONS BOARD
NATIONAL LABOR RELATIONS BOARD
NATIONAL LABOR RELATIONS BOARD
Create successful ePaper yourself
Turn your PDF publications into a flip-book with our unique Google optimized e-Paper software.
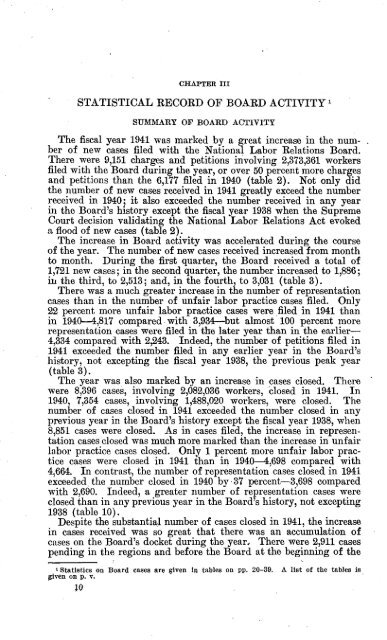
CHAPTER III<br />
STATISTICAL RECORD OF <strong>BOARD</strong> ACTIVITY 1<br />
SUMMARY OF <strong>BOARD</strong> ACTIVITY<br />
The fiscal year 1941 was marked by a great increase in the number<br />
of new cases filed with the National Labor Relations Board.<br />
There were 9,151 charges and petitions involving 2,373,361 workers<br />
filed with the Board during the year, or over 50 percent more charges<br />
and petitions than the 6,177 filed in 1940 (table 2). Not only did<br />
the number of new cases received in 1941 greatly exceed the number<br />
received in 1940; it also exceeded the number received in any year<br />
in the Board's history except the fiscal year 1938 when the Supreme<br />
Court decision validating the National Labor Relations Act evoked<br />
a flood of new cases (table 2).<br />
The increase in Board activity was accelerated during the course<br />
of the year. The number of new cases received increased from month<br />
to month. During the first quarter, the Board received a total of<br />
1,721 new cases; in the second quarter, the number increased to 1,886;<br />
in the third, to 2,513; and, in the fourth, to 3,031 (table 3).<br />
There was a much greater increase in the number of representation<br />
cases than in the number of unfair labor practice cases filed. Only<br />
22 percent more unfair labor practice cases were filed in 1941 than<br />
in 1940-4,817 compared with 3,934—but almost 100 percent more<br />
representation cases were filed in the later year than in the earlier-<br />
4,334 compared with 2,243. Indeed, the number of petitions filed in<br />
1941 exceeded the number filed in any earlier year in the Board's<br />
history, not excepting the fiscal year 1938, the previous peak year<br />
(table 3).<br />
The year was also marked by an increase in cases closed. There<br />
were 8,396 cases, involving 2,082,036 workers, closed in 1941. In<br />
1940, 7,354 cases, involving 1,488,020 workers, were closed. The<br />
number of cases closed in 1941 exceeded the number closed in any<br />
previous year in the Board's history except the fiscal year 1938, when<br />
8,851 cases were closed. As in cases filed, the increase in representation<br />
cases closed was much more marked than the increase in unfair<br />
labor practice cases closed. Only 1 percent more unfair labor practice<br />
cases were closed in 1941 than in 1940-4,698 compared with<br />
4,664. In contrast, the number of representation cases closed in 1941<br />
exceeded the number closed in 1940 by 37 percent-3,698 compared<br />
with 2,690. Indeed, a greater number of representation cases were<br />
closed than in any previous year in the Board's history, not excepting<br />
1938 (table 10).<br />
Despite the substantial number of cases closed in 1941, the increase<br />
in cases received was so great that there was an accumulation of<br />
cases on the Board's docket during the year. There were 2,911 cases<br />
pending in the regions and before the Board at the beginning of the<br />
Statistics on Board cases are given in tables on pp. 20-39. A list of the tables is<br />
given on p. V.<br />
10


