NATIONAL LABOR RELATIONS BOARD
NATIONAL LABOR RELATIONS BOARD
NATIONAL LABOR RELATIONS BOARD

You also want an ePaper? Increase the reach of your titles
YUMPU automatically turns print PDFs into web optimized ePapers that Google loves.
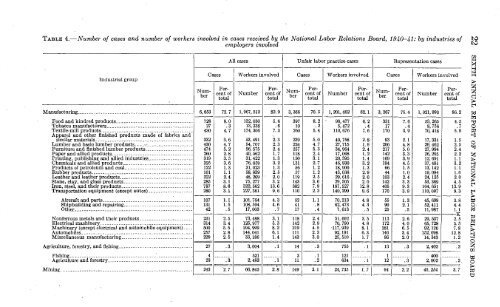
TABLE 4.—Number of cases and number of workers involved in cases received by the National Labor Relations Board, 1940-41: by industries of<br />
employers involved<br />
IND<br />
t\D<br />
All cases Unfair labor practice . cases Representation cases<br />
Industrial group<br />
N um-<br />
ber<br />
Cases Workers involved Cases Workers involved Cases Workers involved<br />
Percent<br />
of<br />
total<br />
Number<br />
Per- -<br />
cent of<br />
total<br />
N um-<br />
ber<br />
Percent<br />
of<br />
total<br />
Number<br />
Percent<br />
of<br />
total<br />
N umber<br />
Percent<br />
of<br />
total<br />
Number<br />
Percent<br />
of<br />
total<br />
Manufacturing 6, 653 72. 7 1,967, 512 82.9 3, 386 70. 3 1, 201, 462 82. 1 3, 267 75. 4 1, 021, 993 86.2<br />
Food and kindred products 728 8. 0 132, 030 5. 6 397 8. 2 • 90, 477 6. 2 331 7. 6 53, 265 4. 5<br />
Tobacco manufacturers 27 . 3 13, 338 . 6 10 . 2 5, 472 . 4 17 . 4 8, 756 . 7<br />
Textile-mill products 430 4. 7 174, 306 7. 3 260 5. 4 110, 676 7. 6 170 3. 9 70, 418 5. 9<br />
Apparel and other finished products made of fabrics and<br />
similar materials 332 3. 6 53, 491 2. 3 239 5.0 40, 758 2. 8 93 2. 1 17, 331 1. 5<br />
Lumber and basic lumber products — 430 4. 7 54, 707 2. 3 224 4. 7 27, 715 1. 9 206 4. 8 29, 462 2. 5<br />
Furniture and finished lumber products 474 5. 2 56, 575 2. 4 257 5. 3 34,964 2. 4 217 5. 0 27, 994 2. 4<br />
Paper and allied products 260 2. 8 40, 562 1. 7 118 2.4 17, 068 1. 2 142 3. 3 26, 295 2. 2<br />
Printing, publishing and allied industries_ 319 3. 5 31, 422 . 1. 3 150 3. 1 20, 395 1. 4 169 3. 9 12, 691 1. 1<br />
Chemicals and allied products 325 3. 6 76, 059 3. 2 131 2. 7 46,930 3. 2 194 4. 5 37, 481 3. 2<br />
Products of petroleum and coal 122 1.3 31,023 1.3 56 1.2 18,960 1.3 66 1.5 13, 142 1.1<br />
Rubber products 101 1. 1 58, 839 2. 5 57 1. 2 43, 038 2.9 44 1. 0 19, 084 1.6<br />
Leather and leather products 222 2.4 48, 269 2.0 119 2.5 29, 616 2.0 103 2.4 24, 125 2.0<br />
Stone, clay, and glass products 285 3. 1 75, 277 3. 2 143 3.0 29, 505 2.0 142 3. 3 53, 369 4. 5<br />
- Iron, steel, and their products 787 8.6 322, 562 13. 6 382 7. 9 187, 527 12. 8 405 9. 3 164, 651 13. 9<br />
Transportation equipment (except autos) 280 3. 1 227, 361 9. 6 110 2. 3 140, 299 9. 6 170 3. 9 110, 097 9. 3<br />
Aircraft and parts 107 1. 1 101, 764 4. 3 52 1. 1 70, 213 4. 8 55 1. 3 45,699 3. 8<br />
Shipbuilding and repairing 131 1. 5 108, 594 4. 6 41 .8 62, 473 4. 3 90 2. 1 52, 411 4. 4<br />
Other 42 . 5 17, 003 . 7 17 . 4 7, 613 . 5 25 . 5 11, 987 1. 1<br />
K<br />
Nonferrous metals and their products<br />
231 2. 5 73, 488 3. 1 118 2. 4 51, 692 3. 5 113 2. 6 29, 537 2. 5<br />
Electrical machinery 314 3. 4 125, 977 5. 3 142 2. 9 70, 790 4. 8 172 4. 0 65, 728 5. 5<br />
Machinery (except electrical and automobile equipment) _ _ _ _ 500 5. 5 194, 999 8. 2 219 4. 5 -117, 939 8. 1 281 6. 5 92, 126 7. 8<br />
Automobiles 257 2. 8 144, 041 6. 1 111 2. 3 92, 191 6. 3 146 3. 4 152,068 12.8<br />
Miscellaneous manufacturing 229 2. 5 33, 186 1. 4 143 3. 0 25, 510 1. 7 86 2. 0 14, 343 1. 2<br />
Agriculture, forestry, and fishing 27 . 3 3,004 . 1 14 . 3 755 . 1 13 . 3 2,402 . 2<br />
Fishing 4 621 3 .1 121 1 400<br />
Agriculture and forestry 23 . 3 2, 483 . 1 11 . 2 634 12 . 3 2, 002 . 2<br />
Mining 243 .2. 7 66, 845 2. 8 149 3. 1 24, 735 1. 7 94 2. 2 45, 254 3. 7