Download - Tools4Ever.com
Download - Tools4Ever.com
Download - Tools4Ever.com

You also want an ePaper? Increase the reach of your titles
YUMPU automatically turns print PDFs into web optimized ePapers that Google loves.
MonitorMagic Implementation Guide<br />
Version 1.0, October 2004<br />
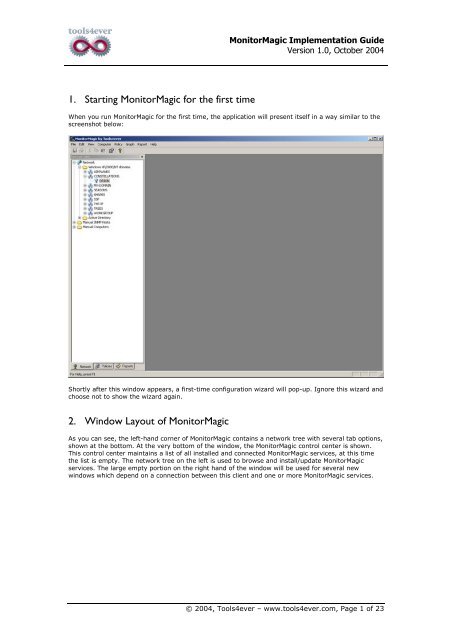
1. Starting MonitorMagic for the first time<br />
When you run MonitorMagic for the first time, the application will present itself in a way similar to the<br />
screenshot below:<br />
Shortly after this window appears, a first-time configuration wizard will pop-up. Ignore this wizard and<br />
choose not to show the wizard again.<br />
2. Window Layout of MonitorMagic<br />
As you can see, the left-hand corner of MonitorMagic contains a network tree with several tab options,<br />
shown at the bottom. At the very bottom of the window, the MonitorMagic control center is shown.<br />
This control center maintains a list of all installed and connected MonitorMagic services, at this time<br />
the list is empty. The network tree on the left is used to browse and install/update MonitorMagic<br />
services. The large empty portion on the right hand of the window will be used for several new<br />
windows which depend on a connection between this client and one or more MonitorMagic services.<br />
© 2004, Tools4ever – www.tools4ever.<strong>com</strong>, Page 1 of 23
MonitorMagic Implementation Guide<br />
Version 1.0, October 2004<br />
3. Deploying a MonitorMagic service<br />
The next step in implementing MonitorMagic is to choose a <strong>com</strong>puter which will run the MonitorMagic<br />
service. In the re<strong>com</strong>mend setup where all monitoring will be performed using the “agentless” setup,<br />
where no services will be installed on target <strong>com</strong>puters, a dedicated <strong>com</strong>puter must be assigned to<br />
host the MonitorMagic service and optionally also the SQL or MSDE database. To install a service,<br />
browse the network tree, then right-click the <strong>com</strong>puter and choose “Setup Service...”.<br />
When installing a MonitorMagic, click the “Advanced” button and make sure you understand the<br />
available options. More information on these options is listed on the next page.<br />
© 2004, Tools4ever – www.tools4ever.<strong>com</strong>, Page 2 of 23
MonitorMagic Implementation Guide<br />
Version 1.0, October 2004<br />
Additional service installation options (Advanced section):<br />
User name<br />
This is the Windows 2000 or Windows NT user account name which will be used by the MonitorMagic<br />
service. If the account does not exist MonitorMagic will create it with the password specified in the<br />
next field. By default, MonitorMagic will create the account MonitorMagicSvcAccnt in the domain you<br />
are logged on to. If the account already exists the password specified in the next field must be<br />
correct. Otherwise, the MonitorMagic service will not start. The syntax of the service account<br />
specification is DOMAIN\ACCOUNTNAME. For Windows 2000 domains you must use the NETBIOS<br />
domain name. If you want to use a local machine account, e.g. not a domain account but a Windows<br />
NT 4.0 workstation or Windows 2000 Professional account name, you should use the syntax<br />
\\COMPUTERNAME\ACCOUNTNAME. When upgrading, this field is not used.<br />
Password<br />
The password of the service account specified in the field User name. If the specified User name<br />
already exists the password must be correct. If MonitorMagic creates the account, the password of the<br />
new account is specified in this field. When upgrading, this field is not used.<br />
Group (Service account group membership)<br />
The MonitorMagic service account will be added to this group. By default, the Domain Admins group is<br />
used. This setting is used to grant the MonitorMagic service sufficient access rights to retrieve<br />
information from all monitored objects and to execute alarm actions. If the MonitorMagic service<br />
account does not have sufficient access rights error messages will appear in the <strong>com</strong>puter Application<br />
event log, and in the MonitorMagic client window.<br />
Group (MonitorMagic administrator group)<br />
This group is used to specify the user accounts that are allowed to configure the MonitorMagic service.<br />
By default, the group is set to the local administrators group. The way this is organized is <strong>com</strong>parable<br />
to the way you setup access control for files and directories.<br />
When the installation <strong>com</strong>pletes successfully, the client will automatically connect to the new<br />
MonitorMagic service, thereby opening a monitor window as shown in the screenshot below:<br />
© 2004, Tools4ever – www.tools4ever.<strong>com</strong>, Page 3 of 23
MonitorMagic Implementation Guide<br />
Version 1.0, October 2004<br />
4. Policies<br />
In the network tree you used to browse and install/update a MonitorMagic service, you will also find<br />
the tabs named Policies and Reports. Click the Policies tab to access the list of pre-configured<br />
policies for applications, network devices, operating systems and hardware devices.<br />
Always make sure you use the latest set of policies released by Tools4ever. The easiest way to obtain<br />
the latest policy bundle is to access our forum through http://forum.tools4ever.<strong>com</strong>. When you have<br />
downloaded the latest policy bundle, delete all existing policies under the Local monitor policies<br />
branch, as shown in the screenshot below. Do this by simply clicking on the first entry, hold shift and<br />
select the last entry, then right-click and select the Delete option. Now select the Local monitor<br />
policies branch, click on the Policy menu, select Import policies… and select the downloaded<br />
policy bundle. You will notice that the policy list has been rebuilt from the new policy bundle.<br />
© 2004, Tools4ever – www.tools4ever.<strong>com</strong>, Page 4 of 23
MonitorMagic Implementation Guide<br />
Version 1.0, October 2004<br />
5. Setup central monitoring policies<br />
The previous chapter explained how to import policies in the local monitoring policies branch. Local<br />
monitoring policies are saved on the client, whereas central monitoring policies are saved on a<br />
MonitorMagic service. This means: Central monitor policies can be shared by multiple<br />
MonitorMagic applications installed on different <strong>com</strong>puters. Local monitor policies cannot<br />
be shared.<br />
To setup central monitoring policies, right-click on the Central monitor policies branch and select<br />
Properties.<br />
In the next dialog, shown in the screenshot below, enter the name of the <strong>com</strong>puter running the<br />
MonitorMagic service. Note that the local policies are stored in the file listed also in this window. When<br />
migrating a client to another <strong>com</strong>puter, be sure to make a backup copy of this file.<br />
© 2004, Tools4ever – www.tools4ever.<strong>com</strong>, Page 5 of 23
MonitorMagic Implementation Guide<br />
Version 1.0, October 2004<br />
6. Using central monitoring policies<br />
Now that central monitoring policies have been configured, let’s start using it by copying the policies<br />
that we actively use in our implementation into the central monitor policies branch. To do this, select<br />
the most widely used policy – “Operating System – Windows General”, right-click and select<br />
Copy.<br />
Now, select the Central monitor policies branch, right-click and click Paste. A copy of the original<br />
policy is now available as a central monitor policy. All clients connecting to the MonitorMagic service<br />
that we have setup can access the same policy.<br />
© 2004, Tools4ever – www.tools4ever.<strong>com</strong>, Page 6 of 23
MonitorMagic Implementation Guide<br />
Version 1.0, October 2004<br />
7. Open a second network browse window<br />
To make applying policies to <strong>com</strong>puters easier, open up a second network browse window by using<br />
the View, Browse Network. This will add a new network browse tree to the right-hand side of the<br />
screen. Note that any modifications made to the browse tree on the left are not replicated to the new<br />
network tree since they operate <strong>com</strong>pletely independent.<br />
© 2004, Tools4ever – www.tools4ever.<strong>com</strong>, Page 7 of 23
MonitorMagic Implementation Guide<br />
Version 1.0, October 2004<br />
8. Service configuration – global keywords & e-mail<br />
To standardize the e-mail notification system, we re<strong>com</strong>mend that you configure a global keyword for<br />
the e-mail recipient so that all e-mail notifications are sent to the same address. When this address<br />
changes, you only have to modify the value of this keyword instead of modifying the e-mail address in<br />
all your policies.<br />
To do this, make sure the MonitorMagic Control Center is enabled. You can enable/disable this window<br />
by selecting the Control center option in the View menu. In this control center, all service<br />
connections are listed and each connection is represented by a green or red status icon. Right-click on<br />
the entry that matches the <strong>com</strong>puter you chose to run the MonitorMagic service and select Configure<br />
service. In the next window, navigate to the Custom keywords tab and add a new entry similar to<br />
the screenshot below. Next, navigate to the SMTP E-mail tab and enter the details of your outgoing<br />
SMTP e-mail server. As the MonitorMagic E-mail Address, you can choose a non-existent address<br />
such as monitormagic@my<strong>com</strong>pany.<strong>com</strong>. Some e-mail servers perform additional security checks<br />
such as the sender’s IP address or Reply-to address, so be careful to specify the correct settings.<br />
© 2004, Tools4ever – www.tools4ever.<strong>com</strong>, Page 8 of 23
MonitorMagic Implementation Guide<br />
Version 1.0, October 2004<br />
9. Configure database support<br />
MonitorMagic needs to be connected to a database to store historical data such as performance data,<br />
free disk space and also event logs. We re<strong>com</strong>mend using a SQL or MSDE database for this purpose.<br />
To configure database support, access the service configuration using the method as described in the<br />
previous chapter, but then navigate to the Advanced tab.<br />
In the Advanced tab, click the Configure database button. In the next dialog, click the Manage<br />
database tab and then the Create button. The create database wizard will be started, click next to<br />
continue until you are requested to choose a database type. Select SQL Server and click next. In the<br />
following dialog, enter the name of the <strong>com</strong>puter where an instance of SQL Server or MSDE is<br />
running. All next dialogs can be ignored since their default settings are ok, so click next until you can<br />
finish the wizard.<br />
When finished, you can click OK on every dialog until you are no longer inside the service<br />
configuration. Now, select the entry in the MonitorMagic Control Center representing the <strong>com</strong>puter<br />
running a MonitorMagic service, right-click and select Refresh. You will notice that the database<br />
column now reads “SqlServer, OK”.<br />
© 2004, Tools4ever – www.tools4ever.<strong>com</strong>, Page 9 of 23
MonitorMagic Implementation Guide<br />
Version 1.0, October 2004<br />
10. Summary Part 1: Configuration<br />
In the previous chapters, you have successfully configured all MonitorMagic fundamentals. A<br />
MonitorMagic service has been installed on a designated <strong>com</strong>puter. All monitoring activity will be<br />
<strong>com</strong>ing from this <strong>com</strong>puter, without installing any services on other <strong>com</strong>puters. All policies have been<br />
updated and central policies have been configured to support policy sharing. You have also added a<br />
second network browse tree to make applying policies to <strong>com</strong>puters easier. To finish the basic service<br />
configuration, all settings related to email notification and database support have been configured.<br />
© 2004, Tools4ever – www.tools4ever.<strong>com</strong>, Page 10 of 23
MonitorMagic Implementation Guide<br />
Version 1.0, October 2004<br />
11. Preparing to apply Windows policies<br />
Before we can begin to apply policies and start monitoring, we have to keep our environment clean<br />
and organized. To do this, drag all <strong>com</strong>puters that will be monitored to the Manual Computers<br />
branch, this automatically creates a copy of the <strong>com</strong>puter in the manual <strong>com</strong>puters folder. You can<br />
also create custom entries for <strong>com</strong>puters that have their browsing service disabled and are therefore<br />
hidden. To do this, right-click on the Manual Computers branch and select Add <strong>com</strong>puter, as<br />
shown below.<br />
© 2004, Tools4ever – www.tools4ever.<strong>com</strong>, Page 11 of 23
MonitorMagic Implementation Guide<br />
Version 1.0, October 2004<br />
12. Apply policies<br />
You can now begin to apply policies to your servers listed in the Manual Computers branch of the<br />
network tree. To do this, drag the Operating System – Windows General policy and drop it on the<br />
top entry of the Manual Computers branch. Repeat this action for every <strong>com</strong>puter. Note that when<br />
you drag-and-drop a policy, new entries appear in the window in the middle of the client, called the<br />
Monitor window.<br />
When applied, policies are activated immediately. As you can see in the screenshot below, a disk<br />
monitor on one of the <strong>com</strong>puters has raised an alert. Based on the configuration performed in<br />
previous chapters, you probably received one or more e-mail alerts from MonitorMagic. When done<br />
applying this policy, scroll through the monitor window and look for red entries. If none exist, you will<br />
not receive any email alerts.<br />
Also note that this window will contain a great number of entries, one for each monitor. As you apply<br />
more policies, this window is not the perfect place to get a quick overview of the status of your<br />
servers, so later on we will introduce a new window for this purpose.<br />
© 2004, Tools4ever – www.tools4ever.<strong>com</strong>, Page 12 of 23
MonitorMagic Implementation Guide<br />
Version 1.0, October 2004<br />
13. Setup report data collection<br />
The first set of policies is now active and is storing data into the database connected to MonitorMagic.<br />
Data storage for the policy Operating System – Windows General has been pre-configured; make<br />
sure for new policies that require data storage, to enable this setting.<br />
The only information that is currently not being recorded into the database is the Windows event log.<br />
Since event logs can be<strong>com</strong>e very large in size, MonitorMagic has a separate scheduler to enable<br />
event log archiving outside office hours to minimize the impact on your network. To enable event<br />
archiving, go to the Report menu and click Configure report data collection. When prompted,<br />
specify the MonitorMagic service which will perform the event archiving operation and continue. The<br />
next dialog is the report profile configuration window, where you can setup how, which and when<br />
event logs are stored. Click the Add button to create a new profile and assign a name to it, as shown<br />
below. Next, select the option to archive only specific logs and select the Application and System logs<br />
from the window. Make sure the checkbox “Get report log information now” is selected, since that<br />
will trigger the immediate event log archiving process for test purposes. Click OK to exit this<br />
configuration and return to the report profiles window. Select the report profile and click the<br />
Computers button. Assign the <strong>com</strong>puters you want to include in the event archiving process and<br />
confirm your configuration by clicking OK until you return to the main client application.<br />
© 2004, Tools4ever – www.tools4ever.<strong>com</strong>, Page 13 of 23
MonitorMagic Implementation Guide<br />
Version 1.0, October 2004<br />
14. Monitoring event archiving<br />
To access the status on the event archiving jobs, go to the Report menu and click Overview report<br />
data collection. A new window opens, containing information about the event archiving jobs. The<br />
event archiving process is separated into jobs for each <strong>com</strong>puter.<br />
Since this window does not automatically refresh, use the F5 key to manually refresh its contents.<br />
Scroll to the right-hand side of this window to see if the collection has finished. In the screenshot<br />
below, you can see that the collection of all three jobs has finished at 10:09.<br />
Note: Make sure all archiving jobs have <strong>com</strong>pleted before continuing.<br />
© 2004, Tools4ever – www.tools4ever.<strong>com</strong>, Page 14 of 23
MonitorMagic Implementation Guide<br />
Version 1.0, October 2004<br />
15. Preparing to apply SNMP policies<br />
MonitorMagic provides integration with several well-known network and hardware devices, such as<br />
Cisco, Dell, HP and IBM. To use this integration, the use of the SNMP protocol is required. This means<br />
that the system or device you want to monitor must be equipped with an active SNMP agent. For<br />
example, to monitor the specific hardware details of a HP Server, it must run the appropriate Insight<br />
Manager agent software.<br />
To simplify working with SNMP policies, create entries for each host or device you want to monitor<br />
using SNMP in the Manual SNMP Hosts branch, as shown below. To access a system using SNMP, a<br />
valid <strong>com</strong>munity string must be passed along with an Object Identifier (OID), which represents the<br />
monitored resource (disk, fan, interface, etc). The OID is embedded into each policy, while the<br />
<strong>com</strong>munity string and IP address is variable per host. As a result, each host must be added separately<br />
by using the Add SNMP host as shown below.<br />
© 2004, Tools4ever – www.tools4ever.<strong>com</strong>, Page 15 of 23
MonitorMagic Implementation Guide<br />
Version 1.0, October 2004<br />
16. Applying SNMP policies<br />
The snmp hosts are in place, so we can now apply SNMP policies to the hosts. Use the same method<br />
as when using Windows policies to drag and drop the policy onto a SNMP host. This example uses the<br />
generic SNMP policy “MonitorMagic – SNMP examples”, which can be activated on any Windows<br />
server that runs the SNMP service. When applied, close the network browse tree on the right-hand<br />
side of the screen to enlarge the client workspace. Scroll the monitor window all the way to the<br />
bottom to inspect the newly added SNMP monitors.<br />
Use this same mechanism to apply Compaq Insight Manager, Dell OpenManage, IBM Director,<br />
or any of the Network devices policies. The APC PowerChute policy is also SNMP enabled. All these<br />
policies have pre-configured rules and notification, so you don’t need to worry about any additional<br />
configuration. The default settings should work fine in most circumstances.<br />
© 2004, Tools4ever – www.tools4ever.<strong>com</strong>, Page 16 of 23
MonitorMagic Implementation Guide<br />
Version 1.0, October 2004<br />
17. Create a ping policy for routers and servers<br />
The final step towards a <strong>com</strong>plete basic MonitorMagic implementation is setting up support for uptime<br />
alerts and reports. To do this, we use the basic ping monitor in addition with database storage, email<br />
notifications and pre-configured reports.<br />
To create a new policy, right-click on the Central monitor policies branch as shown below and select<br />
Create policy. Specify the name “Ping” and click OK. A new empty policy is now available, so select<br />
it and right-click, followed by Add monitor and Ping. We will start by adding the host names for each<br />
Windows server, so click Add in the next dialog.<br />
© 2004, Tools4ever – www.tools4ever.<strong>com</strong>, Page 17 of 23
MonitorMagic Implementation Guide<br />
Version 1.0, October 2004<br />
The first set of monitors we will be creating is for the servers. To create a separate monitor for each<br />
server, specify the NETBIOS <strong>com</strong>puter name in the first edit box. Leave all settings to their defaults<br />
and click OK. You will see that a monitor has been created. Now repeat this procedure for all<br />
monitored Windows servers. When they are added to the list of monitored hosts, click OK to confirm<br />
your configuration. In the properties of the monitor, go to the Database tab and enable database<br />
storage.<br />
When you expand your new Ping policy to the first level, you will notice that a monitor has been<br />
created, which has been automatically named to represent your server names. Right-click on this new<br />
entry and click Rename. Type in the name: “Servers”.<br />
The next batch of ping monitors will be created for the routers and switches. Select the ping policy<br />
and right-click, then select Add monitor, then Ping. Repeat the same procedure as when added<br />
servers, but now type in the IP addresses instead of the NETBIOS host names. Confirm your changes,<br />
and then rename the new monitor to “Routers & Switches”.<br />
To finish the configuration of the Ping policy, we need to add rules and alerts. To do this, select the<br />
monitor that we renamed to “Serves”, right-click and select Add rule. Click Add and specify the rule<br />
as shown in the screenshot above. Click OK to confirm your changes and you will notice that the new<br />
rule has been added to the list of rules. Click on the Alarm actions tab and click Add to add a new<br />
alarm action. Select the E-mail message and click OK to continue. In the destination field, specify<br />
%SMTPALARM% as keyword, since we already defined this as the global source for all notifications.<br />
Click on the Message tab, and specify the contents of the message as shown below.<br />
When you confirm all your changes and return to the main client window, you will notice that when<br />
you expand the Ping policy, then the “Servers” monitor to the deepest level, the rule and the alarm<br />
action have been added. You can quickly replicate the rule and alarm action to the “Routers &<br />
Switches” monitor by simply using copy and paste on the rule.<br />
Now, apply the Ping policy by dragging and dropping it on the Monitor window. When you scroll this<br />
window to the top, you will notice that the ping monitors will appear.<br />
© 2004, Tools4ever – www.tools4ever.<strong>com</strong>, Page 18 of 23
MonitorMagic Implementation Guide<br />
Version 1.0, October 2004<br />
18. Generate reports<br />
Before you run any reports, make sure you download the latest report bundle. The latest version of<br />
the reports is always available on our forum at http://forum.tools4ever.<strong>com</strong>. The download file is a<br />
self-extracting executable which contains all new report templates. To use these templates, close the<br />
MonitorMagic client and browse to the program files folder where the MonitorMagic client application is<br />
installed (Program Files\Tools4ever\MonitorMagic\ReportTemplates). In the ReportTemplates<br />
subfolder, execute the report bundle to extract the report template files. You can now start the<br />
MonitorMagic client application. The new report templates are loaded automatically.<br />
Your configuration is now ready to use the reporting feature. In the policy tree on the left-hand side of<br />
the screen, switch to the Reports tab. Expand all report folders to see all available pre-configured<br />
reports in MonitorMagic.<br />
Reports that Tools4ever re<strong>com</strong>mends for weekly server and network maintenance are the “Server<br />
Advanced Statistics – All Servers – Last Week”, and the “Server Log System Events Per Day -<br />
All Servers - Last Week”. These reports contain all vital status information related to CPU, memory,<br />
disk, uptime, backup & antivirus, and event logs. The second log report adds extra intelligence by<br />
displaying a block of all events per server per day, so you can easily spot anything out of the ordinary<br />
by quickly looking at the size of the blocks. Run these reports by double-clicking on them, or using<br />
right-click, then Generate report.<br />
© 2004, Tools4ever – www.tools4ever.<strong>com</strong>, Page 19 of 23
MonitorMagic Implementation Guide<br />
Version 1.0, October 2004<br />
19. Configure automatic report e-mail distribution<br />
MonitorMagic features automatic report distribution, which means that you can instruct the<br />
MonitorMagic service to generate reports and send them to an e-mail address on a custom schedule.<br />
To configure this, we need to copy the report templates to a location accessible to the MonitorMagic<br />
service. The best way to do this is to create an additional subfolder in the MonitorMagicService folder,<br />
which is created by the service installer in the <strong>com</strong>puter running the MonitorMagic service (default =<br />
Program Files\MonitorMagicService).<br />
To start off, we need to find out what the file names are of the report templates that we want<br />
distributed, so select the report, right-click and select Properties. In the lower edit box, scroll all the<br />
way to the right to find the actual file name, as shown below.<br />
Locate the file or files you have found in the Program Files\Tools4ever\MonitorMagic\ReportTemplates<br />
folder and copy these to the newly created ReportTemplates folder on the <strong>com</strong>puter running the<br />
MonitorMagic service, as shown below. Copy the absolute path, since we will need this later on.<br />
© 2004, Tools4ever – www.tools4ever.<strong>com</strong>, Page 20 of 23
MonitorMagic Implementation Guide<br />
Version 1.0, October 2004<br />
Return to the MonitorMagic client application, go to the Report menu and click Configure report E-<br />
mail distribution. When prompted, select the MonitorMagic service that we have installed in previous<br />
chapters.<br />
Specify the e-mail address without using the %SMTPALARM% keyword, since that is not used in this<br />
operation. Now paste the absolute path in the Directory edit box. Finally, modify the schedule to<br />
something more appropriate like the example shown below. Make sure to enable the checkbox<br />
“Generate and send the reports now (test)”, since that will cause MonitorMagic to immediately<br />
generate and send the reports to the designated mailbox.<br />
© 2004, Tools4ever – www.tools4ever.<strong>com</strong>, Page 21 of 23
MonitorMagic Implementation Guide<br />
Version 1.0, October 2004<br />
20. Global alarm window<br />
The configuration of MonitorMagic is <strong>com</strong>pletely, we can now enable the status overview window,<br />
which is called the Global Alarm Window.<br />
To do this, go to the View menu and select the Global alarm window. Maximize this window and<br />
close both the tree windows on the left and right-hand side of the screen. Sort the first column of this<br />
window to make sure the alarm entries are at the top.<br />
You will notice that the alarm description is cryptic in some cases. This is because the alarm<br />
description is exactly the same as the rule name for each monitor. In order to make these alarms<br />
understandable, edit the rule names for each policy and re-apply them. In the screenshot below, you<br />
can see that the second alarm description has been modified to make it more understandable for an<br />
end user.<br />
© 2004, Tools4ever – www.tools4ever.<strong>com</strong>, Page 22 of 23
MonitorMagic Implementation Guide<br />
Version 1.0, October 2004<br />
21. Summary Part 2: Successful implementation<br />
In the previous chapters, you have successfully configured and implemented MonitorMagic in a typical<br />
network environment. You applied all necessary policies, created a custom policy to monitor servers<br />
and routers & switches using the ping monitor. You then also performed basic SNMP configuration and<br />
applied your first SNMP policy.<br />
To finish the configuration, you have configured MonitorMagic to automatically generate intelligent<br />
reports based on a custom schedule.<br />
© 2004, Tools4ever – www.tools4ever.<strong>com</strong>, Page 23 of 23