Download - Ferrovial - Annual Report 2012
Download - Ferrovial - Annual Report 2012
Download - Ferrovial - Annual Report 2012

Create successful ePaper yourself
Turn your PDF publications into a flip-book with our unique Google optimized e-Paper software.
Consolidated financial statements at 31 December 2011<br />
<strong>Ferrovial</strong> S.A. and Subsidiaries<br />
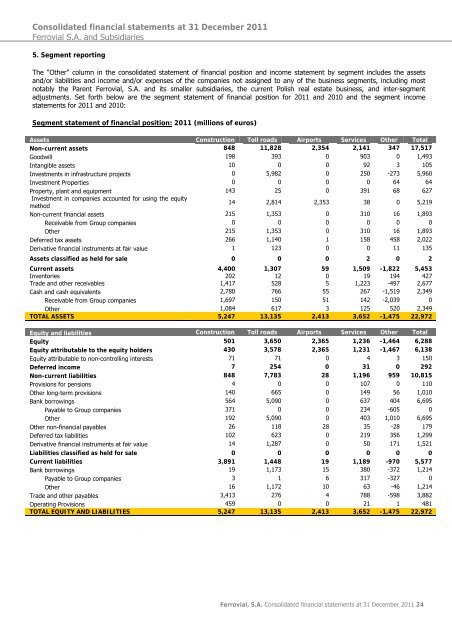
5. Segment reporting<br />
The “Other” column in the consolidated statement of financial position and income statement by segment includes the assets<br />
and/or liabilities and income and/or expenses of the companies not assigned to any of the business segments, including most<br />
notably the Parent <strong>Ferrovial</strong>, S.A. and its smaller subsidiaries, the current Polish real estate business, and inter-segment<br />
adjustments. Set forth below are the segment statement of financial position for 2011 and 2010 and the segment income<br />
statements for 2011 and 2010:<br />
Segment statement of financial position: 2011 (millions of euros)<br />
Assets Construction Toll roads Airports Services Other Total<br />
Non-current assets 848 11,828 2,354 2,141 347 17,517<br />
Goodwill 198 393 0 903 0 1,493<br />
Intangible assets 10 0 0 92 3 105<br />
Investments in infrastructure projects 0 5,982 0 250 -273 5,960<br />
Investment Properties 0 0 0 0 64 64<br />
Property, plant and equipment 143 25 0 391 68 627<br />
Investment in companies accounted for using the equity<br />
method<br />
14 2,814 2,353 38 0 5,219<br />
Non-current financial assets 215 1,353 0 310 16 1,893<br />
Receivable from Group companies 0 0 0 0 0 0<br />
Other 215 1,353 0 310 16 1,893<br />
Deferred tax assets 266 1,140 1 158 458 2,022<br />
Derivative financial instruments at fair value 1 123 0 0 11 135<br />
Assets classified as held for sale 0 0 0 2 0 2<br />
Current assets 4,400 1,307 59 1,509 -1,822 5,453<br />
Inventories 202 12 0 19 194 427<br />
Trade and other receivables 1,417 528 5 1,223 -497 2,677<br />
Cash and cash equivalents 2,780 766 55 267 -1,519 2,349<br />
Receivable from Group companies 1,697 150 51 142 -2,039 0<br />
Other 1,084 617 3 125 520 2,349<br />
TOTAL ASSETS 5,247 13,135 2,413 3,652 -1,475 22,972<br />
Equity and liabilities Construction Toll roads Airports Services Other Total<br />
Equity 501 3,650 2,365 1,236 -1,464 6,288<br />
Equity attributable to the equity holders 430 3,578 2,365 1,231 -1,467 6,138<br />
Equity attributable to non-controlling interests 71 71 0 4 3 150<br />
Deferred income 7 254 0 31 0 292<br />
Non-current liabilities 848 7,783 28 1,196 959 10,815<br />
Provisions for pensions 4 0 0 107 0 110<br />
Other long-term provisions 140 665 0 149 56 1,010<br />
Bank borrowings 564 5,090 0 637 404 6,695<br />
Payable to Group companies 371 0 0 234 -605 0<br />
Other 192 5,090 0 403 1,010 6,695<br />
Other non-financial payables 26 118 28 35 -28 179<br />
Deferred tax liabilities 102 623 0 219 356 1,299<br />
Derivative financial instruments at fair value 14 1,287 0 50 171 1,521<br />
Liabilities classified as held for sale 0 0 0 0 0 0<br />
Current liabilities 3,891 1,448 19 1,189 -970 5,577<br />
Bank borrowings 19 1,173 15 380 -372 1,214<br />
Payable to Group companies 3 1 6 317 -327 0<br />
Other 16 1,172 10 63 -46 1,214<br />
Trade and other payables 3,413 276 4 788 -598 3,882<br />
Operating Provisions 459 0 0 21 1 481<br />
TOTAL EQUITY AND LIABILITIES 5,247 13,135 2,413 3,652 -1,475 22,972<br />
<strong>Ferrovial</strong>, S.A. Consolidated financial statements at 31 December 2011 24