Greenhouse gas conversion factors for company reporting
Greenhouse gas conversion factors for company reporting
Greenhouse gas conversion factors for company reporting

Create successful ePaper yourself
Turn your PDF publications into a flip-book with our unique Google optimized e-Paper software.
2012 Guidelines to Defra / DECC's GHG Conversion Factors <strong>for</strong> Company Reporting<br />
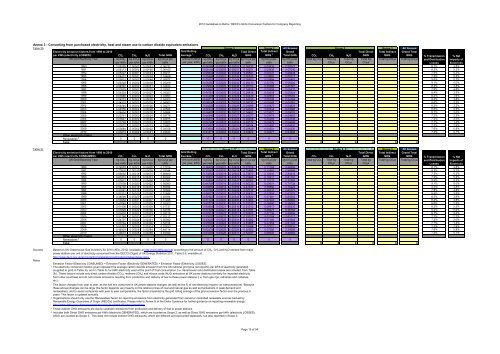
Annex 3 - Converting from purchased electricity, heat and steam use to carbon dioxide equivalent emissions<br />
Table 3b Scope 3<br />
Scope 3 All Scopes Scope 3 All Scopes<br />
Electricity emission <strong>factors</strong> from 1990 to 2010<br />
per kWh (electricity LOSSES): CO 2 CH 4 N 2O Total GHG<br />
Grid Rolling<br />
Average 1 : CO 2 CH 4 N 2O<br />
Total Direct<br />
GHG<br />
Total Indirect<br />
GHG 3 Grand<br />
Total GHG CO 2 CH 4 N 2O<br />
Total Direct<br />
GHG<br />
Total Indirect<br />
GHG<br />
Grand Total<br />
GHG % Transmission % Net<br />
UK Grid Electricity Year kg CO 2 kg CO 2e kg CO 2e kg CO 2e per Amount USED kg CO 2 kg CO 2e kg CO 2e kg CO 2e per kg CO 2e per kg CO 2e per Total kg CO 2 Total kg Total kg Total kg Total kg CO 2e Total kg CO 2e and Distribution Imports of<br />
per kWh per kWh per kWh kWh<br />
per year, kWh per kWh per kWh per kWh kWh<br />
kWh<br />
kWh<br />
CO 2e CO 2e CO 2e<br />
Losses Electricity<br />
1990 0.06185 0.00002 0.00051 0.06237 0.06185 0.00002 0.00051 0.06237 0.00835 0.07072 8.1% 3.8%<br />
1991 0.06113 0.00002 0.00050 0.06165 0.06149 0.00002 0.00051 0.06201 0.00839 0.07040 8.3% 5.2%<br />
1992 0.05227 0.00001 0.00043 0.05271 0.05842 0.00002 0.00048 0.05891 0.00747 0.06638 7.5% 5.3%<br />
1993 0.04431 0.00001 0.00034 0.04466 0.05489 0.00001 0.00044 0.05535 0.00683 0.06217 7.2% 5.2%<br />
1994 0.05831 0.00002 0.00044 0.05877 0.05557 0.00002 0.00044 0.05603 0.00884 0.06487 9.6% 5.2%<br />
1995 0.05229 0.00002 0.00038 0.05269 0.05366 0.00002 0.00042 0.05410 0.00790 0.06200 9.1% 5.0%<br />
1996 0.04597 0.00002 0.00031 0.04630 0.05063 0.00002 0.00038 0.05103 0.00688 0.05791 8.4% 4.8%<br />
1997 0.03925 0.00001 0.00025 0.03951 0.04803 0.00002 0.00034 0.04838 0.00594 0.05432 7.8% 4.8%<br />
1998 0.04324 0.00002 0.00027 0.04353 0.04781 0.00002 0.00033 0.04816 0.00608 0.05424 8.4% 3.5%<br />
1999 0.03968 0.00002 0.00023 0.03993 0.04408 0.00002 0.00029 0.04439 0.00563 0.05002 8.3% 3.9%<br />
2000 0.04273 0.00002 0.00026 0.04300 0.04217 0.00002 0.00026 0.04245 0.00549 0.04794 8.4% 3.8%<br />
2001 0.04533 0.00002 0.00028 0.04563 0.04205 0.00002 0.00026 0.04232 0.00549 0.04781 8.6% 2.8%<br />
2002 0.04244 0.00002 0.00026 0.04271 0.04268 0.00002 0.00026 0.04296 0.00527 0.04824 8.3% 2.2%<br />
2003 0.04559 0.00002 0.00028 0.04589 0.04315 0.00002 0.00026 0.04343 0.00544 0.04888 8.5% 0.6%<br />
2004 0.04654 0.00002 0.00028 0.04684 0.04452 0.00002 0.00027 0.04481 0.00572 0.05053 8.7% 2.0%<br />
2005 0.03751 0.00002 0.00024 0.03776 0.04348 0.00002 0.00027 0.04377 0.00479 0.04855 7.2% 2.2%<br />
2006 0.03947 0.00002 0.00026 0.03975 0.04231 0.00002 0.00026 0.04259 0.00483 0.04742 7.2% 2.0%<br />
2007 0.03799 0.00002 0.00024 0.03825 0.04142 0.00002 0.00026 0.04170 0.00479 0.04649 7.1% 1.4%<br />
2008 0.03837 0.00002 0.00023 0.03861 0.03997 0.00002 0.00025 0.04024 0.00492 0.04516 7.3% 2.9%<br />
2009 0.03684 0.00002 0.00022 0.03708 0.03804 0.00002 0.00024 0.03829 0.00501 0.04330 7.6% 0.8%<br />
2010 0.03619 0.00002 0.00021 0.03643 0.03777 0.00002 0.00023 0.03802 0.00477 0.04280 7.4% 0.7%<br />
Other electricity factor<br />
Renewables 2 0 0 0 0 0 0 0 0 0 0<br />
Total 0 0 0 0 0 0<br />
Table 3c Scope 3 All Scopes Scope 2, 3 3<br />
Scope 3 All Scopes<br />
Electricity emission <strong>factors</strong> from 1990 to 2010<br />
per kWh (electricity CONSUMED): CO 2 CH 4 N 2O Total GHG<br />
Grid Rolling<br />
Average 1 : CO 2 CH 4 N 2O<br />
Total Direct<br />
GHG<br />
Total Indirect<br />
GHG 3 Grand<br />
Total GHG CO 2 CH 4 N 2O<br />
Total Direct<br />
GHG<br />
Total Indirect<br />
GHG<br />
Grand Total<br />
GHG % Transmission % Net<br />
UK Grid Electricity Year kg CO 2 kg CO 2e kg CO 2e kg CO 2e per Amount USED kg CO 2 kg CO 2e kg CO 2e kg CO 2e per kg CO 2e per kg CO 2e per Total kg CO 2 Total kg Total kg Total kg Total kg CO 2e Total kg CO 2e and Distribution Imports of<br />
per kWh per kWh per kWh kWh<br />
per year, kWh per kWh per kWh per kWh kWh<br />
kWh<br />
kWh<br />
CO 2e CO 2e CO 2e<br />
Losses Electricity<br />
1990 0.76578 0.00021 0.00628 0.77226 0.76578 0.00021 0.00628 0.77226 0.11169 0.88395 8.1% 3.8%<br />
1991 0.73916 0.00019 0.00609 0.74544 0.75247 0.00020 0.00618 0.75885 0.10983 0.86868 8.3% 5.2%<br />
1992 0.69262 0.00018 0.00570 0.69850 0.73252 0.00019 0.00602 0.73873 0.10643 0.84516 7.5% 5.3%<br />
1993 0.61810 0.00018 0.00473 0.62302 0.70391 0.00019 0.00570 0.70980 0.10211 0.81191 7.2% 5.2%<br />
1994 0.60912 0.00020 0.00456 0.61387 0.68496 0.00019 0.00547 0.69062 0.10123 0.79185 9.6% 5.2%<br />
1995 0.57639 0.00020 0.00422 0.58080 0.64708 0.00019 0.00506 0.65233 0.09501 0.74734 9.1% 5.0%<br />
1996 0.54702 0.00019 0.00372 0.55094 0.60865 0.00019 0.00459 0.61343 0.08880 0.70223 8.4% 4.8%<br />
1997 0.50361 0.00018 0.00319 0.50698 0.57085 0.00019 0.00408 0.57512 0.08210 0.65722 7.8% 4.8%<br />
1998 0.51501 0.00020 0.00326 0.51846 0.55023 0.00019 0.00379 0.55421 0.07854 0.63275 8.4% 3.5%<br />
1999 0.48096 0.00020 0.00278 0.48394 0.52460 0.00019 0.00343 0.52822 0.07381 0.60203 8.3% 3.9%<br />
2000 0.50958 0.00021 0.00307 0.51286 0.51124 0.00020 0.00320 0.51463 0.07097 0.58560 8.4% 3.8%<br />
2001 0.52949 0.00022 0.00329 0.53300 0.50773 0.00020 0.00312 0.51105 0.06960 0.58065 8.6% 2.8%<br />
2002 0.51406 0.00022 0.00309 0.51737 0.50982 0.00021 0.00310 0.51313 0.06917 0.58230 8.3% 2.2%<br />
2003 0.53828 0.00022 0.00336 0.54186 0.51448 0.00021 0.00312 0.51781 0.06973 0.58754 8.5% 0.6%<br />
2004 0.53430 0.00022 0.00323 0.53776 0.52514 0.00022 0.00321 0.52857 0.07139 0.59996 8.7% 2.0%<br />
2005 0.51766 0.00023 0.00327 0.52117 0.52676 0.00022 0.00325 0.53023 0.07094 0.60117 7.2% 2.2%<br />
2006 0.54707 0.00024 0.00361 0.55092 0.53028 0.00023 0.00331 0.53382 0.07180 0.60562 7.2% 2.0%<br />
2007 0.53794 0.00025 0.00336 0.54154 0.53505 0.00023 0.00337 0.53865 0.07255 0.61120 7.1% 1.4%<br />
2008 0.52493 0.00026 0.00314 0.52833 0.53238 0.00024 0.00332 0.53594 0.07221 0.60815 7.3% 2.9%<br />
2009 0.48403 0.00028 0.00284 0.48714 0.52233 0.00025 0.00324 0.52582 0.07086 0.59668 7.6% 0.8%<br />
2010 0.49072 0.00028 0.00289 0.49390 0.51694 0.00026 0.00317 0.52037 0.06945 0.58982 7.4% 0.7%<br />
Other electricity factor<br />
Renewables 2 0 0 0 0 0 0 0 0 0 0<br />
Total 0 0 0 0 0 0<br />
Scope 2, 3 4 Scope 3<br />
Sources<br />
Notes<br />
Based on UK <strong>Greenhouse</strong> Gas Inventory <strong>for</strong> 2010 (AEA, 2012) (available at http://naei.defra.gov.uk) according to the amount of CO 2, CH 4 and N 2O emitted from major<br />
power stations per unit of electricity consumed from the DECC's Digest of UK Energy Statistics 2011, Table 5.6, available at:<br />
http://www.decc.gov.uk/en/content/cms/statistics/publications/dukes/dukes.aspx<br />
Emission Factor (Electricity CONSUMED) = Emission Factor (Electricity GENERATED) + Emission Factor (Electricity LOSSES)<br />
1 The electricity <strong>conversion</strong> <strong>factors</strong> given represent the average carbon dioxide emission from the UK national grid (plus net imports) per kWh of electricity generated<br />
(supplied to grid) in Table 3a, and in Table 3c <strong>for</strong> kWh electricity used at the point of final consumption (i.e. transmission and distribution losses are included, from Table<br />
3b). These <strong>factors</strong> include only direct carbon dioxide (CO 2), methane (CH 4) and nitrous oxide (N 2O) emissions at UK power stations (similarly <strong>for</strong> imported electricity<br />
from other countries) and do not include emissions resulting from production and delivery of fuel to these power stations (i.e. from <strong>gas</strong> rigs, refineries and collieries,<br />
etc.).<br />
This factor changes from year to year, as the fuel mix consumed in UK power stations changes (as well as the % of net electricity imports via interconnectors). Because<br />
these annual changes can be large (the factor depends very heavily on the relative prices of coal and natural <strong>gas</strong> as well as fluctuations in peak demand and<br />
renewables), and to assist companies with year to year comparability, the factor presented is the grid rolling average of the grid <strong>conversion</strong> factor over the previous 5<br />
years. This factor is updated annually.<br />
2 Organisations should only use the 'Renewables' factor <strong>for</strong> <strong>reporting</strong> emissions from electricity generated from owned or controlled renewable sources backed by<br />
Renewable Energy Guarantee of Origin (REGOs) certificates. Please refer to Annex G of the Defra Guidance <strong>for</strong> further guidance on <strong>reporting</strong> renewable energy:<br />
http://www.defra.gov.uk/environment/economy/business-efficiency/<strong>reporting</strong>/<br />
3 These indirect GHG emissions are due to upstream emissions from production and delivery of fuel to power stations.<br />
4 Includes both Direct GHG emissions per kWh (electricity GENERATED), which are counted as Scope 2, as well as Direct GHG emissions per kWh (electricity LOSSES),<br />
which are counted as Scope 3. This does not include Indirect GHG emissions, which are different and accounted separately, but also reported in Scope 3.<br />
Page 15 of 54