Greenhouse gas conversion factors for company reporting
Greenhouse gas conversion factors for company reporting
Greenhouse gas conversion factors for company reporting

You also want an ePaper? Increase the reach of your titles
YUMPU automatically turns print PDFs into web optimized ePapers that Google loves.
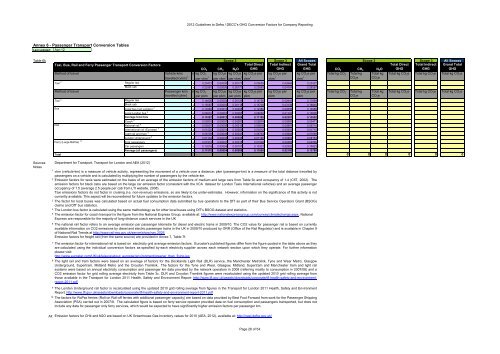
2012 Guidelines to Defra / DECC's GHG Conversion Factors <strong>for</strong> Company Reporting<br />
Annex 6 - Passenger Transport Conversion Tables<br />
Last updated: Apr-12<br />
Scope 3<br />
x kg CO Total kg CO Total kg<br />
Table 6k Scope 3<br />
Scope 3 All Scopes Scope 3 All Scopes<br />
Taxi 2 Regular taxi<br />
x 0.20477 0.00005 0.00177 0.20659 0.02668 0.23327<br />
Taxi, Bus, Rail and Ferry Passenger Transport Conversion Factors<br />
Total Direct Total Indirect Grand Total<br />
Total Direct Total Indirect Grand Total<br />
5 CO 2 CH 4 N 2 O GHG<br />
GHG<br />
GHG CO 2 CH 4 N 2 O GHG<br />
GHG<br />
GHG<br />
Method of travel<br />
Vehicle kms<br />
kg CO 2 e kg CO 2 e kg CO 2 e per kg CO 2 e per kg CO 2 e per<br />
Total kg Total kg CO 2 e Total kg CO 2 e Total kg CO 2 e<br />
travelled (vkm) 1 2<br />
per vkm 1 per vkm 1 per vkm 1 vkm 1<br />
vkm 1<br />
vkm 1 2<br />
CO 2 e CO 2 e<br />
Black cab<br />
x 0.23381 0.00005 0.00177 0.23563 0.04704 0.28267<br />
Method of travel<br />
Passenger kms x kg CO 2 kg CO 2 e kg CO 2 e kg CO 2 e per kg CO 2 e per kg CO 2 e per Total kg CO 2 Total kg Total kg Total kg CO 2 e Total kg CO 2 e Total kg CO 2 e<br />
travelled (pkm) per pkm per pkm per pkm pkm<br />
pkm<br />
pkm<br />
CO 2 e CO 2 e<br />
Taxi 2<br />
Regular taxi<br />
x 0.14626 0.00004 0.00126 0.14756 0.02943 0.17699<br />
Black cab<br />
x 0.15587 0.00003 0.00118 0.15709 0.03136 0.18845<br />
Bus Local bus (not London) 3<br />
x 0.12269 0.00013 0.00098 0.12380 0.02606 0.14986<br />
Local London bus 4<br />
x 0.08201 0.00007 0.00055 0.08263 0.01742 0.10005<br />
Average local bus<br />
x 0.11097 0.00012 0.00086 0.11195 0.02357 0.13552<br />
Coach 5<br />
x 0.02810 0.00007 0.00057 0.02874 0.00597 0.03471<br />
Rail<br />
National rail 6<br />
x 0.05501 0.00005 0.00312 0.05818 0.00897 0.06715<br />
International rail (Eurostar) 7<br />
x 0.01502 0.00001 0.00009 0.01512 0.00203 0.01715<br />
Light rail and tram 8<br />
x 0.06709 0.00003 0.00041 0.06753 0.00906 0.07659<br />
London Underground 9<br />
x 0.07142 0.00004 0.00044 0.07190 0.00964 0.08154<br />
Ferry (Large RoPax) 10<br />
Foot passengers<br />
x 0.01912 0.00001 0.00015 0.01928 0.00362 0.02290<br />
Total<br />
Car passengers<br />
Average (all passengers)<br />
x 0.13216 0.00004 0.00101 0.13321 0.02502 0.15823<br />
x 0.11516 0.00004 0.00088 0.11608 0.02180 0.13788<br />
0 0 0 0 0 0<br />
Sources<br />
Notes<br />
Department <strong>for</strong> Transport, Transport <strong>for</strong> London and AEA (2012)<br />
1<br />
vkm (vehicle-km) is a measure of vehicle activity, representing the movement of a vehicle over a distance; pkm (passenger-km) is a measure of the total distance travelled by<br />
passengers on a vehicle and is calculated by multiplying the number of passengers by the vehicle-km.<br />
2 Emission <strong>factors</strong> <strong>for</strong> taxis were estimated on the basis of an average of the emission <strong>factors</strong> of medium and large cars from Table 6c and occupancy of 1.4 (CfIT, 2002). The<br />
emission <strong>factors</strong> <strong>for</strong> black cabs are based on the large car emission factor (consistent with the VCA dataset <strong>for</strong> London Taxis International vehicles) and an average passenger<br />
occupancy of 1.5 (average 2.5 people per cab from LTI website, 2008).<br />
Taxi emissions <strong>factors</strong> do not factor in cruising (i.e. non-revenue) emissions, so are likely to be under-estimates. However, in<strong>for</strong>mation on the significance of this activity is not<br />
currently available. This aspect will be reconsidered <strong>for</strong> future updates to the emission <strong>factors</strong>.<br />
3 The factor <strong>for</strong> local buses was calculated based on actual fuel consumption data submitted by bus operators to the DfT as part of their Bus Service Operators Grant (BSOG)<br />
claims and DfT bus statistics.<br />
4 The London bus factor is calculated using the same methodology as <strong>for</strong> other local buses using DfT's BSOG dataset and statistics.<br />
5 The emission factor <strong>for</strong> coach transport is the figure from the National Express Group, available at: http://www.nationalexpressgroup.com/ourway/climatechange.aspx. National<br />
Express are responsible <strong>for</strong> the majority of long-distance coach services in the UK<br />
6 The national rail factor refers to an average emission per passenger kilometre <strong>for</strong> diesel and electric trains in 2009/10. The CO2 value <strong>for</strong> passenger rail is based on currently<br />
available in<strong>for</strong>mation on CO2 emissions by diesel and electric passenger trains in the UK in 2009/10 produced by ORR (Office of the Rail Regulator) and is available in Chapter 9<br />
of National Rail Trends at http://www.rail-reg.gov.uk/server/show/nav.2026<br />
Emission <strong>factors</strong> <strong>for</strong> freight rail (from the same source) are provided in Annex 7, Table 7f.<br />
7 The emission factor <strong>for</strong> international rail is based on electricity grid average emission <strong>factors</strong>. Eurostar's published figures differ from the figure quoted in the table above as they<br />
are calculated using the individual <strong>conversion</strong> <strong>factors</strong> as specified by each electricity supplier across each network section upon which they operate. For further in<strong>for</strong>mation<br />
please visit:<br />
http://www.eurostar.com/UK/uk/leisure/about_eurostar/environment/greener_than_flying.jsp<br />
8 The light rail and tram <strong>factors</strong> were based on an average of <strong>factors</strong> <strong>for</strong> the Docklands Light Rail (DLR) service, the Manchester Metrolink, Tyne and Wear Metro, Glasgow<br />
Underground, Supertram, Midland Metro and the Croydon Tramlink. The <strong>factors</strong> <strong>for</strong> the Tyne and Wear, Glasgow, Midland, Supertram and Manchester tram and light rail<br />
systems were based on annual electricity consumption and passenger km data provided by the network operators in 2008 (referring mostly to consumption in 2007/08) and a<br />
CO2 emission factor <strong>for</strong> grid rolling average electricity from Table 3c. DLR and Croydon Tramlink figures were recalculated using the updated 2010 grid rolling average from<br />
those available in the Transport <strong>for</strong> London 2011 Health, Safety and Environment Report: http://www.tfl.gov.uk/assets/downloads/corporate/tfl-health-safety-and-environmentreport-2011.pdf<br />
9 The London Underground rail factor is recalculated using the updated 2010 grid rolling average from figures in the Transport <strong>for</strong> London 2011 Health, Safety and Environment<br />
Report: http://www.tfl.gov.uk/assets/downloads/corporate/tfl-health-safety-and-environment-report-2011.pdf<br />
10 The <strong>factors</strong> <strong>for</strong> RoPax ferries (Roll-on Roll-off ferries with additional passenger capacity) are based on data provided by Best Foot Forward from work <strong>for</strong> the Passenger Shipping<br />
Association (PSA) carried out in 2007/8. The calculated figure is based on ferry service operator provided data on fuel consumption and passengers transported, but does not<br />
include any data <strong>for</strong> passenger only ferry services, which would be expected to have significantly higher emission <strong>factors</strong> per passenger km.<br />
All: Emission <strong>factors</strong> <strong>for</strong> CH4 and N2O are based on UK <strong>Greenhouse</strong> Gas Inventory values <strong>for</strong> 2010 (AEA, 2012), available at: http://naei.defra.gov.uk/<br />
Page 26 of 54