Greenhouse gas conversion factors for company reporting
Greenhouse gas conversion factors for company reporting
Greenhouse gas conversion factors for company reporting

Create successful ePaper yourself
Turn your PDF publications into a flip-book with our unique Google optimized e-Paper software.
2012 Guidelines to Defra / DECC's GHG Conversion Factors <strong>for</strong> Company Reporting<br />
Annex 7 - Freight Transport Conversion Tables<br />
Last updated: Apr-12<br />
How to use this Annex<br />
A tonne-km is a measure of transported goods representing the movement of one tonne over one km. To use the tables below you will need to multiply the weight of goods (in tonnes) by the distance<br />
travelled by that mode (in km).<br />
If you know how much of a particular fuel type is consumed, emissions can be calculated using Table 7a. This is the most accurate way to calculate emissions.<br />
Table 7b gives emissions <strong>for</strong> distance travelled <strong>for</strong> vans and small trucks<br />
Table 7c gives emissions per tonne freight carried <strong>for</strong> vans and small trucks. Emission <strong>factors</strong> <strong>for</strong> vans in tonne km were calculated from the emission <strong>factors</strong> per vehicle km provided in Table 6i (Annex 6)<br />
and an average load factor of 40%. The average cargo capacity was taken to be 0.6 tonnes <strong>for</strong> vans up to 1.305 tonnes vehicle reference weight, 1 tonne <strong>for</strong> vans between 1.305-1.740 tonnes vehicle<br />
reference weight and 2 tonnes <strong>for</strong> vans up to 3.5 tonnes vehicle reference weight. Reference weight is equivalent to the vehicle kerb weight plus 60kg.<br />
Table 7d gives emissions per vehicle kilometre travelled <strong>for</strong> a range of HGV sizes with a range of different loads. Use this table if you know the distance the vehicle has travelled. If you do not know the<br />
load capacity of your vehicle, apply the UK average load which is given <strong>for</strong> a range of vehicle classes.<br />
Tables 7d and 7e are provided as alternative methods <strong>for</strong> calculating CO 2 emissions from movement of freight by HGVs. The <strong>factors</strong> in g/vehicle.km (Table 7d) are sufficient (and with the ability to take into<br />
account different loading <strong>factors</strong> are preferential) <strong>for</strong> an operator who simply wants to calculate and compare CO 2 emissions <strong>for</strong> different ways of transporting goods around by optimising freight logistics.<br />
Factors in Table 7e may be better to use when comparing road freight with other modes <strong>for</strong> transporting a given weight of freight a given distance. To avoid double-counting, it is important that calculations<br />
DO NOT USE BOTH methods.<br />
Table 7e gives emissions per tonne kilometre travelled <strong>for</strong> a range of HGV sizes with a range of different loads. Use this table if you know the distance the freight has travelled and what the mass (in<br />
tonnes) of the freight was.<br />
Table 7f gives emissions <strong>factors</strong> <strong>for</strong> tonne kilometres of freight <strong>for</strong> rail , and air freight<br />
Table 7g gives emissions <strong>factors</strong> <strong>for</strong> tonne kilometres of freight <strong>for</strong> shipping<br />
Annex 7 Scopes & Boundaries:<br />
Scope 1: Direct emissions of CO2, CH4 and N2O from the combustion of fuel from owned/controlled transport.<br />
Scope 3: Indirect emissions associated with the extraction and transport of primary fuels as well as the refining, distribution, storage and retail of finished fuels. Emission <strong>factors</strong> are based on data from the<br />
JEC Well-To-Wheels study, <strong>for</strong> further in<strong>for</strong>mation see: http://iet.jrc.ec.europa.eu/about-jec/<br />
Scope 1 OR Scope 3: Direct emissions from transport can fall into either Scope 1 or Scope 3, depending on the vehicle ownership/level of control. For vehicles owned or directly controlled by a <strong>reporting</strong><br />
<strong>company</strong>, direct emissions should be reported under Scope 1. However, emissions resulting from transport-related activities in vehicles not owned or controlled by the <strong>reporting</strong> entity should be reported<br />
under Scope 3.<br />
In general it is recommended that the 'control' approach is used in order to decide whether to report emissions as Scope 1 or Scope 3. The control approach is itself divided into two methods – financial and<br />
operational ( where the financial control approach is the one most commonly recommended).<br />
A further consideration is the treatment of leased assets (e.g. vehicles), which depends on the organisational boundaries set and the control approach.<br />
Further in<strong>for</strong>mation on scopes, control and leased assets and other sector specific guidance (<strong>for</strong> freight transport) is available from Defra's website in the guidance on <strong>reporting</strong> at:<br />
http://www.defra.gov.uk/environment/economy/business-efficiency/<strong>reporting</strong>/<br />
OR from the <strong>Greenhouse</strong> Gas Protocol's website at:<br />
http://www.ghgprotocol.org/standards/corporate-standard<br />
How do I determine UK rail travel distances (in miles) where start and destination stations are known?<br />
1. Click on web link: http://www.networkrail.co.uk/aspx/3828.aspx<br />
2. Select the Route Index under Train Timetables<br />
3. Use your mouse cursor to click on the appropriate train route in the 'Table' column that matches your starting and destination stations. This should open a corresponding timetable with rail distances.<br />
4. In the timetable, refer to the 'Miles' columns on the left to determine mileage between your starting and destination stations.<br />
How were these <strong>factors</strong> calculated?<br />
For further explanation on how these emission <strong>factors</strong> have been derived, please refer to the GHG <strong>conversion</strong> factor methodology paper available here:<br />
http://www.defra.gov.uk/environment/economy/business-efficiency/<strong>reporting</strong><br />
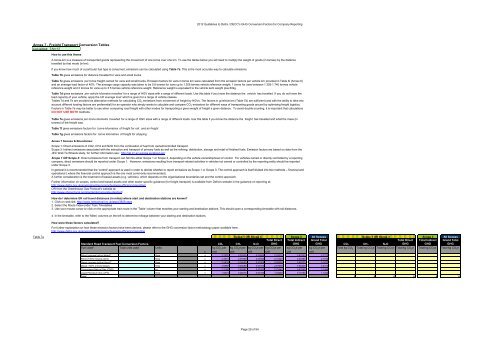
Table 7a Scope 1 OR Scope 3<br />
Scope 3 All Scopes Scope 1 OR Scope 3<br />
Scope 3 All Scopes<br />
#REF! Standard Road Transport Fuel Conversion Factors<br />
CO 2 CH 4 N 2O<br />
Total Direct<br />
GHG<br />
Total Indirect<br />
GHG<br />
Grand Total<br />
GHG CO 2 CH 4 N 2O<br />
Total Direct<br />
GHG<br />
Total Indirect<br />
GHG<br />
Grand Total<br />
GHG<br />
Fuel used*<br />
Total units used<br />
Units<br />
kg CO 2 per kg CO 2e per kg CO 2e per kg CO 2e per kg CO 2e per kg CO 2e per Total kg CO 2 Total kg CO 2e Total kg CO 2e Total kg CO 2e Total kg CO 2e Total kg CO 2e<br />
x unit unit unit unit<br />
unit<br />
unit<br />
Petrol (average biofuel blend)* litres x 2.2332 0.00330 0.00580 2.24230 0.47500 2.7173<br />
Petrol (100% mineral petrol)<br />
litres x 2.3051 0.00330 0.00590 2.31440 0.46380 2.7782<br />
Diesel (average biofuel blend)* litres x 2.5636 0.00090 0.01900 2.58350 0.58370 3.1672<br />
Diesel (100% mineral diesel)<br />
Compressed Natural Gas (CNG)<br />
Liquid Petroleum Gas (LPG)<br />
Total<br />
litres x 2.6569 0.00090 0.01910 2.67690 0.56440 3.2413<br />
kg x 2.7188 0.00397 0.00162 2.72442 0.42240 3.1468<br />
litres x 1.5301 0.00070 0.00180 1.53260 0.19180 1.7244<br />
0 0 0 0 0 0<br />
Page 29 of 54