Greenhouse gas conversion factors for company reporting
Greenhouse gas conversion factors for company reporting
Greenhouse gas conversion factors for company reporting

Create successful ePaper yourself
Turn your PDF publications into a flip-book with our unique Google optimized e-Paper software.
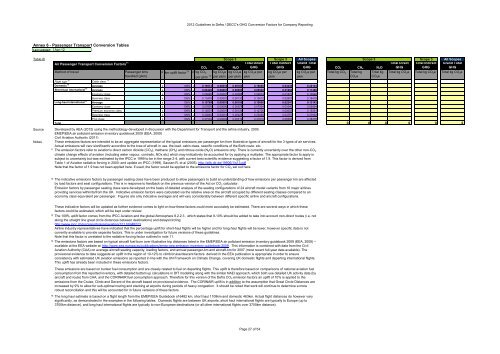
2012 Guidelines to Defra / DECC's GHG Conversion Factors <strong>for</strong> Company Reporting<br />
Annex 6 - Passenger Transport Conversion Tables<br />
Last updated: Apr-12<br />
Table 6l Scope 3<br />
Scope 3 All Scopes Scope 3<br />
Scope 3 All Scopes<br />
Air Passenger Transport Conversion Factors 11 Total Direct Total Indirect Grand Total<br />
Total Direct Total Indirect Grand Total<br />
6 CO 2 CH 4 N 2 O GHG<br />
GHG<br />
GHG CO 2 CH 4 N 2 O GHG<br />
GHG<br />
GHG<br />
Method of travel<br />
Passenger kms x km uplift factor 13 x kg CO 2 kg CO 2 e kg CO 2 e kg CO 2 e per kg CO 2 e per kg CO 2 e per Total kg CO 2 Total kg Total kg Total kg CO 2 e Total kg CO 2 e Total kg CO 2 e<br />
travelled (pkm)<br />
per pkm 14 per pkm per pkm pkm<br />
pkm<br />
pkm<br />
CO 2 e CO 2 e<br />
Source<br />
Notes<br />
Flight type 15 Cabin class 12<br />
Domestic 15 Average x 109% x 0.16513 0.00010 0.00163 0.16685 0.03439 0.20124<br />
Short-haul international 15 Average x 109% x 0.09429 0.00001 0.00093 0.09522 0.01964 0.11486<br />
Economy class x 109% x 0.08985 0.00001 0.00088 0.09074 0.01872 0.10946<br />
Business class x 109% x 0.13478 0.00001 0.00133 0.13612 0.02807 0.16419<br />
Long-haul international 15 Average x 109% x 0.10789 0.00001 0.00106 0.10896 0.02247 0.13143<br />
Total<br />
Economy class x 109% x 0.07876 0.00000 0.00078 0.07954 0.01640 0.09594<br />
Premium economy class x 109% x 0.12601 0.00001 0.00124 0.12726 0.02625 0.15351<br />
Business class x 109% x 0.22840 0.00001 0.00225 0.23066 0.04757 0.27823<br />
First class x 109% x 0.31504 0.00002 0.00310 0.31816 0.06562 0.38378<br />
Developed by AEA (2012) using the methodology developed in discussion with the Department <strong>for</strong> Transport and the airline industry, 2009.<br />
EMEP/EEA air pollutant emission inventory guidebook 2009 (EEA, 2009)<br />
Civil Aviation Authority (2011)<br />
These emissions <strong>factors</strong> are intended to be an aggregate representation of the typical emissions per passenger km from illustrative types of aircraft <strong>for</strong> the 3 types of air services.<br />
Actual emissions will vary significantly according to the type of aircraft in use, the load, cabin class, specific conditions of the flight route, etc.<br />
11 The emission <strong>factors</strong> refer to aviation's direct carbon dioxide (CO 2 ), methane (CH 4 ) and nitrous oxide (N 2 O) emissions only. There is currently uncertainty over the other non-CO 2<br />
climate change effects of aviation (including water vapour, contrails, NOx etc) which may indicatively be accounted <strong>for</strong> by applying a multiplier. The appropriate factor to apply is<br />
subject to uncertainty but was estimated by the IPCC in 1999 to be in the range 2-4, with current best scientific evidence suggesting a factor of 1.9. This factor is derived from<br />
Table 1 of Aviation radiative <strong>for</strong>cing in 2000: and update on IPCC (1999), Sausen R. et al (2005): http://elib.dlr.de/19906/1/s13.pdf<br />
Note that the factor of 1.9 has not been applied here. If used, the factor would be applied to the emissions factor <strong>for</strong> CO 2 set out here.<br />
0 0 0 0 0 0<br />
12 The indicative emissions <strong>factors</strong> by passenger seating class have been produced to allow passengers to build an understanding of how emissions per passenger km are affected<br />
by load <strong>factors</strong> and seat configurations. This is in response to feedback on the previous version of the Act on CO 2 calculator.<br />
Emission <strong>factors</strong> by passenger seating class were developed on the basis of detailed analysis of the seating configurations of 24 aircraft model variants from 16 major airlines<br />
providing services within/to/from the UK. Indicative emission <strong>factors</strong> were calculated via the relative area on the aircraft occupied by different seating classes compared to an<br />
economy class equivalent per passenger. Figures are only indicative averages and will vary considerably between different specific airline and aircraft configurations.<br />
These indicative <strong>factors</strong> will be updated as further evidence comes to light on how these <strong>factors</strong> could more accurately be estimated. There are several ways in which these<br />
<strong>factors</strong> could be estimated, which will be kept under review.<br />
13 The 109% uplift factor comes from the IPCC Aviation and the global Atmosphere 8.2.2.3 , which states that 9-10% should be added to take into account non-direct routes (i.e. not<br />
along the straight line great circle distances between destinations) and delays/circling:<br />
http://www.ipcc.ch/ipccreports/sres/aviation/121.htm#8223<br />
Airline industry representatives have indicated that the percentage uplift <strong>for</strong> short-haul flights will be higher and <strong>for</strong> long-haul flights will be lower, however specific data is not<br />
currently available to provide separate <strong>factors</strong>. This is under investigation <strong>for</strong> future versions of these guidelines.<br />
Note that this factor is unrelated to the radiative <strong>for</strong>cing factor outlined in note 11.<br />
14 The emissions <strong>factors</strong> are based on typical aircraft fuel burn over illustrative trip distances listed in the EMEP/EEA air pollutant emission inventory guidebook 2009 (EEA, 2009) –<br />
available at the EEA website at: http://www.eea.europa.eu/publications/emep-eea-emission-inventory-guidebook-2009. This in<strong>for</strong>mation is combined with data from the Civil<br />
Aviation Authority (CAA) on average aircraft seating capacity, loading <strong>factors</strong>, and annual passenger-km and aircraft-km <strong>for</strong> 2007 (most recent full-year data available). The<br />
provisional evidence to date suggests an uplift in the region of 10-12% to climb/cruise/descent <strong>factors</strong> derived in the EEA publication is appropriate in order to ensure<br />
consistency with estimated UK aviation emissions as reported in line with the UN Framework on Climate Change, covering UK domestic flights and departing international flights.<br />
This uplift has already been included in these emissions <strong>factors</strong>.<br />
These emissions are based on bunker fuel consumption and are closely related to fuel on departing flights. This uplift is there<strong>for</strong>e based on comparisons of national aviation fuel<br />
consumption from this reported inventory, with detailed bottom up calculations in DfT modelling along with the similar NAEI approach, which both use detailed UK activity data (by<br />
aircraft and route) from CAA, and the CORINAIR fuel consumption approach. There<strong>for</strong>e <strong>for</strong> this version of the Defra CO 2 emission <strong>factors</strong> an uplift of 10% is applied to the<br />
emissions from the Cruise, Climb and Decent of the aircraft based on provisional evidence. The CORINAIR uplift is in addition to the assumption that Great Circle Distances are<br />
increased by 9% to allow <strong>for</strong> sub-optimal routing and stacking at airports during periods of heavy congestion. It should be noted that work will continue to determine a more<br />
robust reconciliation and this will be accounted <strong>for</strong> in future versions of these <strong>factors</strong>.<br />
15 The long haul estimate is based on a flight length from the EMEP/EEA Guidebook of 6482 km, short haul 1108km and domestic 463km. Actual flight distances do however vary<br />
significantly, as demonstrated in the examples in the following tables. Domestic flights are between UK airports, short haul international flights are typically to Europe (up to<br />
3700km distance), and long haul international flights are typically to non-European destinations (or all other international flights over 3700km distance).<br />
Page 27 of 54