Greenhouse gas conversion factors for company reporting
Greenhouse gas conversion factors for company reporting
Greenhouse gas conversion factors for company reporting

Create successful ePaper yourself
Turn your PDF publications into a flip-book with our unique Google optimized e-Paper software.
2012 Guidelines to Defra / DECC's GHG Conversion Factors <strong>for</strong> Company Reporting<br />
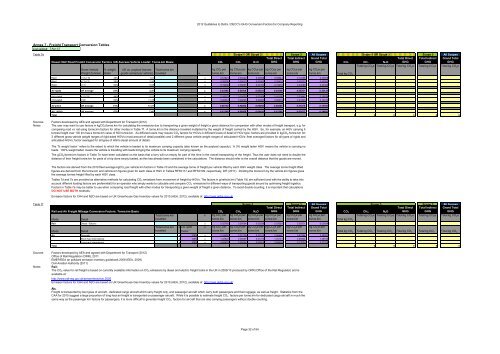
Annex 7 - Freight Transport Conversion Tables<br />
Last updated: Apr-12<br />
Table 7e Scope 1 OR Scope 3<br />
Scope 3 All Scopes Scope 1 OR Scope 3<br />
Scope 3 All Scopes<br />
#REF! Diesel HGV Road Freight Conversion Factors (UK Average Vehicle Loads): Tonne.km Basis<br />
CO 2 CH 4 N 2O<br />
Total Direct<br />
GHG<br />
Total Indirect<br />
GHG<br />
Grand Total<br />
GHG CO 2 CH 4 N 2O<br />
Total Direct<br />
GHG<br />
Total Indirect<br />
GHG<br />
Grand Total<br />
GHG<br />
Gross Vehicle<br />
Weight (tonnes)<br />
% weight<br />
laden<br />
UK av. payload (tonnes Total tonne km<br />
goods carried per vehicle) travelled<br />
x<br />
kg CO 2 per<br />
tonne.km<br />
kg CO 2e per<br />
tonne.km<br />
kg CO 2e per<br />
tonne.km<br />
kg CO 2e per<br />
tonne.km<br />
kg CO 2e per<br />
tonne.km<br />
Rigid >3.5-7.5t 46% 1.01 x 0.57921 0.00022 0.00599 0.58542 0.12436 0.70978<br />
Rigid >7.5-17t 39% 2.06 x 0.35035 0.00013 0.00362 0.35410 0.07522 0.42932<br />
Rigid >17t 54% 5.08 x 0.19030 0.00007 0.00197 0.19234 0.04086 0.23320<br />
All rigids UK average 53% 3.35 x 0.24595 0.00009 0.00254 0.24858 0.05281 0.30139<br />
Articulated >3.5-33t 44% 5.51 x 0.16023 0.00009 0.00166 0.16198 0.03441 0.19639<br />
Articulated >33t 62% 11.78 x 0.08381 0.00005 0.00087 0.08473 0.01800 0.10273<br />
All artics UK average 61% 11.31 x 0.08730 0.00005 0.00090 0.08825 0.01875 0.10700<br />
ALL HGVs UK average 57% 7.40 x 0.12168 0.00008 0.00190 0.12366 0.02627 0.14993<br />
Total kg CO 2e Total kg CO 2e Total kg CO 2e Total kg CO 2e Total kg CO 2e<br />
kg CO 2e per<br />
Total 0 0 0 0 0 0<br />
Sources<br />
Notes<br />
Factors developed by AEA and agreed with Department <strong>for</strong> Transport (2012)<br />
The user may want to use <strong>factors</strong> in kgCO 2/tonne.km <strong>for</strong> calculating the emissions due to transporting a given weight of freight a given distance <strong>for</strong> comparison with other modes of freight transport, e.g. <strong>for</strong><br />
comparing road vs rail using tonne.km <strong>factors</strong> <strong>for</strong> other modes in Table 7f. A tonne.km is the distance travelled multiplied by the weight of freight carried by the HGV. So, <strong>for</strong> example, an HGV carrying 5<br />
tonnes freight over 100 km has a tonne.km value of 500 tonne.km. As different users may require CO 2 <strong>factors</strong> <strong>for</strong> HGVs in different levels of detail of HGV type, <strong>factors</strong> are provided in kgCO 2 /tonne.km <strong>for</strong>:<br />
3 different gross vehicle weight ranges of rigid-axled HGVs (most amount of detail possible) and 2 different gross vehicle weight ranges of articulated HGVs; fleet averaged <strong>factors</strong> <strong>for</strong> all types of rigids and<br />
articulated HGVs; factor averaged <strong>for</strong> all types of HGVs (least amount of detail).<br />
The '% weight laden ' refers to the extent to which the vehicle is loaded to its maximum carrying capacity (also known as the payload capacity). A 0% weight laden HGV means the vehicle is carrying no<br />
loads. 100% weight laden means the vehicle is travelling with loads bringing the vehicle to its maximum carrying capacity.<br />
The gCO 2/tonne.km <strong>factors</strong> in Table 7e have been calculated on the basis that a lorry will run empty <strong>for</strong> part of the time in the overall transporting of the freight. Thus the user does not need to double the<br />
distance of their freight tonne.km <strong>for</strong> parts of a trip done empty loaded, as this has already been considered in the calculations. The distance should refer to the overall distance that the goods are moved.<br />
The <strong>factors</strong> are derived from the 2010 fleet average kgCO 2 per vehicle km <strong>factors</strong> in Table 7d and the average tonne of freight per vehicle lifted by each HGV weight class. The average tonne freight lifted<br />
figures are derived from the tonne.km and vehicle.km figures given <strong>for</strong> each class of HGV in Tables RFS0117 and RFS0109, respectively, DfT (2011). Dividing the tonne.km by the vehicle.km figures gives<br />
the average tonnes freight lifted by each HGV class.<br />
Tables 7d and 7e are provided as alternative methods <strong>for</strong> calculating CO 2 emissions from movement of freight by HGVs. The <strong>factors</strong> in g/vehicle.km (Table 7d) are sufficient (and with the ability to take into<br />
account different loading <strong>factors</strong> are preferential) <strong>for</strong> an operator who simply wants to calculate and compare CO 2 emissions <strong>for</strong> different ways of transporting goods around by optimising freight logistics.<br />
Factors in Table 7e may be better to use when comparing road freight with other modes <strong>for</strong> transporting a given weight of freight a given distance. To avoid double-counting, it is important that calculations<br />
DO NOT USE BOTH methods.<br />
Emission <strong>factors</strong> <strong>for</strong> CH4 and N2O are based on UK <strong>Greenhouse</strong> Gas Inventory values <strong>for</strong> 2010 (AEA, 2012), available at: http://naei.defra.gov.uk/<br />
Total kg CO Total kg CO Total kg CO Total kg CO Total kg CO<br />
Table 7f Scope 3<br />
Scope 3 All Scopes Scope 3<br />
Scope 3 All Scopes<br />
Rail and Air Freight Mileage Conversion Factors: Tonne.km Basis<br />
CO 2 CH 4 N 2O<br />
Total Direct<br />
GHG<br />
Total Indirect<br />
GHG<br />
Grand Total<br />
GHG CO 2 CH 4 N 2O<br />
Total Direct<br />
GHG<br />
Total Indirect<br />
GHG<br />
Grand Total<br />
GHG<br />
Total tonne km<br />
x kg CO 2 per kg CO 2e per kg CO 2e per kg CO 2e per kg CO 2e per kg CO 2e per<br />
Mode<br />
Detail<br />
travelled<br />
tonne.km tonne.km tonne.km tonne.km tonne.km tonne.km Total kg CO 2<br />
2e 2e 2e 2e 2e<br />
Rail Diesel / Electric x 0.02760 0.00004 0.00299 0.03063 0.00571 0.03634<br />
Total tonne km x km uplift x kg CO 2 per kg CO 2e per kg CO 2e per kg CO 2e per kg CO 2e per kg CO 2e per<br />
Mode<br />
Detail<br />
travelled<br />
factor 1 tonne.km tonne.km tonne.km tonne.km tonne.km tonne.km Total kg CO 2 Total kg CO 2 Total kg CO 2 Total kg CO 2 Total kg CO 2 Total kg CO 2<br />
Air Domestic x 109% x 2.04350 0.00126 0.02012 2.06487 0.42564 2.49051<br />
Short-haul international x 109% x 1.22924 0.00007 0.01210 1.24141 0.25604 1.49745<br />
Long-haul international x 109% x 0.63470 0.00004 0.00625 0.64099 0.13220 0.77319<br />
Total 0 0 0 0 0 0<br />
Sources<br />
Notes<br />
Factors developed by AEA and agreed with Department <strong>for</strong> Transport (2012)<br />
Office of Rail Regulation (ORR), 2011.<br />
EMEP/EEA air pollutant emission inventory guidebook 2009 (EEA, 2009)<br />
Civil Aviation Authority (2011)<br />
Rail:<br />
The CO 2 value <strong>for</strong> rail freight is based on currently available in<strong>for</strong>mation on CO 2 emissions by diesel and electric freight trains in the UK in 2009/10 produced by ORR (Office of the Rail Regulator) and is<br />
available at:<br />
http://www.rail-reg.gov.uk/server/show/nav.2026<br />
Emission <strong>factors</strong> <strong>for</strong> CH4 and N2O are based on UK <strong>Greenhouse</strong> Gas Inventory values <strong>for</strong> 2010 (AEA, 2012), available at: http://naei.defra.gov.uk/<br />
Air:<br />
Freight is transported by two types of aircraft - dedicated cargo aircraft which carry freight only, and passenger aircraft which carry both passengers and their luggage, as well as freight. Statistics from the<br />
CAA <strong>for</strong> 2010 suggest a large proportion of long haul air freight is transported on passenger aircraft. While it is possible to estimate freight CO 2 <strong>factors</strong> per tonne.km <strong>for</strong> dedicated cargo aircraft in much the<br />
same way as the passenger.km <strong>factors</strong> <strong>for</strong> passengers, it is more difficult to generate freight CO 2 <strong>factors</strong> <strong>for</strong> aircraft that are also carrying passengers without double-counting.<br />
Page 32 of 54