Greenhouse gas conversion factors for company reporting
Greenhouse gas conversion factors for company reporting
Greenhouse gas conversion factors for company reporting

You also want an ePaper? Increase the reach of your titles
YUMPU automatically turns print PDFs into web optimized ePapers that Google loves.
2012 Guidelines to Defra / DECC's GHG Conversion Factors <strong>for</strong> Company Reporting<br />
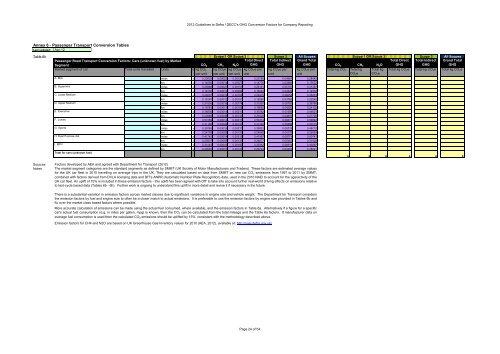
Annex 6 - Passenger Transport Conversion Tables<br />
Last updated: Apr-12<br />
Table 6h Scope 1 OR Scope 3 Scope 3 All Scopes Scope 1 OR Scope 3<br />
Scope 3 All Scopes<br />
2<br />
Passenger Road Transport Conversion Factors: Cars (unknown fuel) by Market<br />
Segment<br />
CO 2 CH 4 N 2 O<br />
Total Direct<br />
GHG<br />
Total Indirect<br />
GHG<br />
Grand Total<br />
GHG CO 2 CH 4 N 2 O<br />
Total Direct<br />
GHG<br />
Total Indirect<br />
GHG<br />
Grand Total<br />
GHG<br />
Market segment of car<br />
Total units travelled Units<br />
x kg CO 2 kg CO 2 e kg CO 2 e kg CO 2 e per kg CO 2 e per kg CO 2 e per Total kg CO 2 Total kg Total kg Total kg CO 2 e Total kg CO 2 e Total kg CO 2 e<br />
per unit per unit per unit unit<br />
unit<br />
unit<br />
CO 2 e CO 2 e<br />
A. Mini<br />
miles<br />
x 0.23633 0.00023 0.00124 0.23780 0.04661 0.28440<br />
A. Mini<br />
km<br />
x 0.14685 0.00014 0.00077 0.14776 0.02896 0.17672<br />
B. Supermini<br />
miles<br />
x 0.25968 0.00021 0.00151 0.26141 0.05197 0.31337<br />
B. Supermini<br />
km<br />
x 0.16136 0.00013 0.00094 0.16243 0.03229 0.19472<br />
C. Lower Medium<br />
miles<br />
x 0.29237 0.00019 0.00163 0.29419 0.06054 0.35473<br />
C. Lower Medium<br />
km<br />
x 0.18167 0.00012 0.00101 0.18280 0.03762 0.22042<br />
D. Upper Medium<br />
miles<br />
x 0.31805 0.00018 0.00174 0.31997 0.06791 0.38788<br />
D. Upper Medium<br />
km<br />
x 0.19763 0.00011 0.00108 0.19882 0.04220 0.24102<br />
E. Executive<br />
miles<br />
x 0.36836 0.00014 0.00211 0.37062 0.07559 0.44621<br />
E. Executive<br />
km<br />
x 0.22889 0.00009 0.00131 0.23029 0.04697 0.27726<br />
F. Luxury<br />
miles<br />
x 0.50189 0.00014 0.00211 0.50414 0.09477 0.59892<br />
F. Luxury<br />
km<br />
x 0.31186 0.00009 0.00131 0.31326 0.05889 0.37215<br />
G. Sports<br />
miles<br />
x 0.39765 0.00014 0.00211 0.39991 0.06719 0.46710<br />
G. Sports<br />
km<br />
x 0.24709 0.00009 0.00131 0.24849 0.04175 0.29024<br />
H. Dual Purpose 4x4<br />
miles<br />
x 0.41742 0.00014 0.00211 0.41967 0.08774 0.50741<br />
H. Dual Purpose 4x4<br />
km<br />
x 0.25937 0.00009 0.00131 0.26077 0.05452 0.31529<br />
I. MPV<br />
miles<br />
x 0.33143 0.00016 0.00193 0.33352 0.06915 0.40267<br />
I. MPV<br />
km<br />
x 0.20594 0.00010 0.00120 0.20724 0.04297 0.25021<br />
Total <strong>for</strong> cars (unknown fuel)<br />
0 0 0 0 0 0<br />
Sources<br />
Notes<br />
Factors developed by AEA and agreed with Department <strong>for</strong> Transport (2012)<br />
The market segment categories are the standard segments as defined by SMMT (UK Society of Motor Manufacturers and Traders). These <strong>factors</strong> are estimated average values<br />
<strong>for</strong> the UK car fleet in 2010 travelling on average trips in the UK. They are calculated based on data from SMMT on new car CO 2 emissions from 1997 to 2011 by SMMT,<br />
combined with <strong>factors</strong> derived from DVLA licensing data and DfT's ANPR (Automatic Number Plate Recognition) data, used in the 2010 NAEI to account <strong>for</strong> the age/activity of the<br />
UK car fleet. An uplift of 15% is included in these emission <strong>factors</strong> - this uplift has been agreed with DfT to take into account further real-world driving effects on emissions relative<br />
to test-cycle based data (Tables 6b - 6h). Further work is ongoing to understand this uplift in more detail and revise it if necessary in the future.<br />
There is a substantial variation in emission <strong>factors</strong> across market classes due to significant variations in engine size and vehicle weight. The Department <strong>for</strong> Transport considers<br />
the emission <strong>factors</strong> by fuel and engine size to often be a closer match to actual emissions. It is preferable to use the emission <strong>factors</strong> by engine size provided in Tables 6b and<br />
6c over the market class based <strong>factors</strong> where possible.<br />
More accurate calculation of emissions can be made using the actual fuel consumed, where available, and the emission <strong>factors</strong> in Table 6a. Alternatively if a figure <strong>for</strong> a specific<br />
car's actual fuel consumption (e.g. in miles per gallon, mpg) is known, then the CO 2 can be calculated from the total mileage and the Table 6a <strong>factors</strong>. If manufacturer data on<br />
average fuel consumption is used then the calculated CO 2 emissions should be uplifted by 15%, consistent with the methodology described above.<br />
Emission <strong>factors</strong> <strong>for</strong> CH4 and N2O are based on UK <strong>Greenhouse</strong> Gas Inventory values <strong>for</strong> 2010 (AEA, 2012), available at: http://naei.defra.gov.uk/<br />
Page 24 of 54