Greenhouse gas conversion factors for company reporting
Greenhouse gas conversion factors for company reporting
Greenhouse gas conversion factors for company reporting

You also want an ePaper? Increase the reach of your titles
YUMPU automatically turns print PDFs into web optimized ePapers that Google loves.
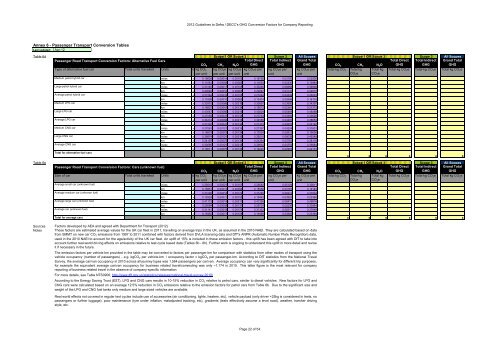
2012 Guidelines to Defra / DECC's GHG Conversion Factors <strong>for</strong> Company Reporting<br />
Annex 6 - Passenger Transport Conversion Tables<br />
Last updated: Apr-12<br />
Table 6d Scope 1 OR Scope 3<br />
Scope 3 All Scopes Scope 1 OR Scope 3<br />
Scope 3 All Scopes<br />
Passenger Road Transport Conversion Factors: Alternative Fuel Cars<br />
Total Direct Total Indirect Grand Total<br />
Total Direct Total Indirect Grand Total<br />
1 CO 2 CH 4 N 2 O GHG<br />
GHG<br />
GHG CO 2 CH 4 N 2 O GHG<br />
GHG<br />
GHG<br />
Type of alternative fuel car<br />
Total units travelled Units<br />
x kg CO 2 kg CO 2 e kg CO 2 e kg CO 2 e per kg CO 2 e per kg CO 2 e per Total kg CO 2 Total kg Total kg Total kg CO 2 e Total kg CO 2 e Total kg CO 2 e<br />
per unit per unit per unit unit<br />
unit<br />
unit<br />
CO 2 e CO 2 e<br />
Medium petrol hybrid car<br />
miles<br />
x 0.18638 0.00014 0.00105 0.18755 0.03750 0.22505<br />
Medium petrol hybrid car<br />
km<br />
x 0.11581 0.00008 0.00065 0.11654 0.02330 0.13984<br />
Large petrol hybrid car<br />
miles<br />
x 0.33140 0.00017 0.00105 0.33260 0.06668 0.39928<br />
Large petrol hybrid car<br />
km<br />
x 0.20592 0.00010 0.00065 0.20667 0.04143 0.24810<br />
Average petrol hybrid car<br />
miles<br />
x 0.21564 0.00016 0.00105 0.21684 0.04339 0.26023<br />
Average petrol hybrid car<br />
km<br />
x 0.13399 0.00010 0.00065 0.13474 0.02696 0.16170<br />
Medium LPG car<br />
miles<br />
x 0.30315 0.00066 0.00216 0.30597 0.03800 0.34397<br />
Medium LPG or CNG car<br />
km<br />
x 0.18837 0.00041 0.00134 0.19012 0.02361 0.21373<br />
Large LPG car<br />
miles<br />
x 0.43547 0.00066 0.00216 0.43829 0.05459 0.49288<br />
Large LPG or CNG car<br />
km<br />
x 0.27059 0.00041 0.00134 0.27234 0.03392 0.30626<br />
Average LPG car<br />
miles<br />
x 0.34274 0.00066 0.00216 0.34556 0.04297 0.38853<br />
Average LPG or CNG car<br />
km<br />
x 0.21297 0.00041 0.00134 0.21472 0.02670 0.24142<br />
Medium CNG car<br />
miles<br />
x 0.27061 0.00121 0.00216 0.27397 0.04204 0.31601<br />
Medium LPG or CNG car<br />
km<br />
x 0.16815 0.00075 0.00134 0.17024 0.02612 0.19636<br />
Large CNG car<br />
miles<br />
x 0.38874 0.00121 0.00216 0.39210 0.06038 0.45248<br />
Large LPG or CNG car<br />
km<br />
x 0.24155 0.00075 0.00134 0.24364 0.03752 0.28116<br />
Average CNG car<br />
miles<br />
x 0.30595 0.00121 0.00216 0.30932 0.04752 0.35684<br />
Average LPG or CNG car<br />
km<br />
x 0.19011 0.00075 0.00134 0.19220 0.02953 0.22173<br />
Total <strong>for</strong> alternative fuel cars<br />
0 0 0 0 0 0<br />
Table 6e Scope 1 OR Scope 3 Scope 3 All Scopes Scope 1 OR Scope 3<br />
Scope 3 All Scopes<br />
Passenger Road Transport Conversion Factors: Cars (unknown fuel)<br />
Total Direct Total Indirect Grand Total<br />
Total Direct Total Indirect Grand Total<br />
1 CO 2 CH 4 N 2 O GHG<br />
GHG<br />
GHG CO 2 CH 4 N 2 O GHG<br />
GHG<br />
GHG<br />
Size of car<br />
Total units travelled Units<br />
x kg CO 2 kg CO 2 e kg CO 2 e kg CO 2 e per kg CO 2 e per kg CO 2 e per Total kg CO 2 Total kg Total kg Total kg CO 2 e Total kg CO 2 e Total kg CO 2 e<br />
per unit per unit per unit unit<br />
unit<br />
unit<br />
CO 2 e CO 2 e<br />
Average small car (unknown fuel)<br />
miles<br />
x 0.25510 0.00021 0.00151 0.25682 0.05129 0.30811<br />
Average medium car (unknown fuel)<br />
Average large car (unknown fuel)<br />
Average car (unknown fuel)<br />
Total <strong>for</strong> average cars<br />
km<br />
miles<br />
km<br />
miles<br />
km<br />
miles<br />
km<br />
x 0.15851 0.00013 0.00094 0.15958 0.03187 0.19145<br />
x 0.31099 0.00018 0.00174 0.31290 0.06313 0.37604<br />
x 0.19324 0.00011 0.00108 0.19443 0.03923 0.23366<br />
x 0.41173 0.00014 0.00211 0.41399 0.08417 0.49816<br />
x 0.25584 0.00009 0.00131 0.25724 0.05230 0.30954<br />
x 0.31141 0.00018 0.00174 0.31332 0.06317 0.37649<br />
x 0.19350 0.00011 0.00108 0.19469 0.03925 0.23394<br />
0 0 0 0 0 0<br />
Sources<br />
Notes<br />
Factors developed by AEA and agreed with Department <strong>for</strong> Transport (2012)<br />
These <strong>factors</strong> are estimated average values <strong>for</strong> the UK car fleet in 2011, travelling on average trips in the UK, as assumed in the 2010 NAEI. They are calculated based on data<br />
from SMMT on new car CO 2 emissions from 1997 to 2011 combined with <strong>factors</strong> derived from DVLA licensing data and DfT's ANPR (Automatic Number Plate Recognition) data,<br />
used in the 2010 NAEI to account <strong>for</strong> the age/activity of the UK car fleet. An uplift of 15% is included in these emission <strong>factors</strong> - this uplift has been agreed with DfT to take into<br />
account further real-world driving effects on emissions relative to test-cycle based data (Tables 6b - 6h). Further work is ongoing to understand this uplift in more detail and revise<br />
it if necessary in the future.<br />
The emission <strong>factors</strong> per vehicle-km provided in the table may be converted to <strong>factors</strong> per passenger-km <strong>for</strong> comparison with statistics from other modes of transport using the<br />
vehicle occupancy (number of passengers) - e.g. kgCO 2 per vehicle-km / occupancy factor = kgCO 2 per passenger-km. According to DfT statistics from the National Travel<br />
Survey, the average car/van occupancy in 2010 across all journey types was 1.564 passengers per car/van. Average occupancy can vary significantly <strong>for</strong> different trip purposes,<br />
<strong>for</strong> example the equivalent average car/van occupancy <strong>for</strong> business related travel/commuting was only ~1.174 in 2010. This latter figure is the most relevant <strong>for</strong> <strong>company</strong><br />
<strong>reporting</strong> of business related travel in the absence of <strong>company</strong>-specific in<strong>for</strong>mation.<br />
For more details, see Table NTS0906, http://www.dft.gov.uk/statistics/releases/national-travel-survey-2010/<br />
According to the Energy Saving Trust (EST), LPG and CNG cars results in 10-15% reduction in CO 2 relative to petrol cars, similar to diesel vehicles. New <strong>factors</strong> <strong>for</strong> LPG and<br />
CNG cars were calculated based on an average 12.5% reduction in CO 2 emissions relative to the emission <strong>factors</strong> <strong>for</strong> petrol cars from Table 6b. Due to the significant size and<br />
weight of the LPG and CNG fuel tanks only medium and large sized vehicles are available.<br />
Real world effects not covered in regular test cycles include use of accessories (air conditioning, lights, heaters, etc), vehicle payload (only driver +25kg is considered in tests, no<br />
passengers or further luggage), poor maintenance (tyre under inflation, maladjusted tracking, etc), gradients (tests effectively assume a level road), weather, harsher driving<br />
style, etc.<br />
Page 22 of 54