Annual Report 2012 - Inwido
Annual Report 2012 - Inwido
Annual Report 2012 - Inwido

Create successful ePaper yourself
Turn your PDF publications into a flip-book with our unique Google optimized e-Paper software.
FINANCIAL STATEMENTS<br />
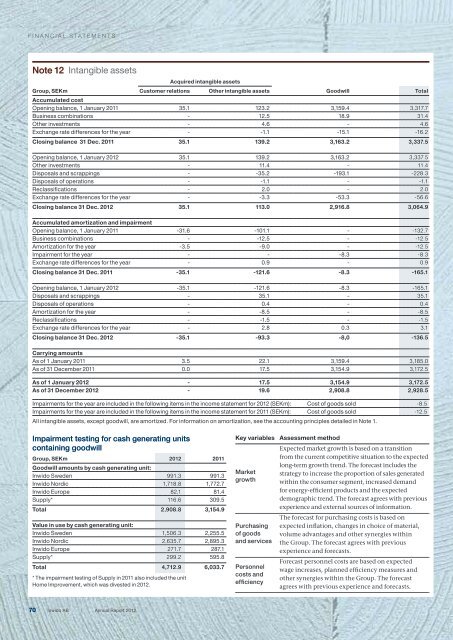
Note 12 Intangible assets<br />
Acquired intangible assets<br />
Group, SEKm Customer relations Other intangible assets Goodwill Total<br />
Accumulated cost<br />
Opening balance, 1 January 2011 35.1 123.2 3,159.4 3,317.7<br />
Business combinations - 12.5 18.9 31.4<br />
Other investments - 4.6 - 4.6<br />
Exchange rate differences for the year - -1.1 -15.1 -16.2<br />
Closing balance 31 Dec. 2011 35.1 139.2 3,163.2 3,337.5<br />
Opening balance, 1 January <strong>2012</strong> 35.1 139.2 3,163.2 3,337.5<br />
Other investments - 11.4 - 11.4<br />
Disposals and scrappings - -35.2 -193.1 -228.3<br />
Disposals of operations - -1.1 - -1.1<br />
Reclassifications - 2.0 - 2.0<br />
Exchange rate differences for the year - -3.3 -53.3 -56.6<br />
Closing balance 31 Dec. <strong>2012</strong> 35.1 113.0 2,916.8 3,064.9<br />
Accumulated amortization and impairment<br />
Opening balance, 1 January 2011 -31.6 -101.1 - -132.7<br />
Business combinations - -12.5 - -12.5<br />
Amortization for the year -3.5 -9.0 - -12.5<br />
Impairment for the year - - -8.3 -8.3<br />
Exchange rate differences for the year - 0.9 - 0.9<br />
Closing balance 31 Dec. 2011 -35.1 -121.6 -8.3 -165.1<br />
Opening balance, 1 January <strong>2012</strong> -35.1 -121.6 -8.3 -165.1<br />
Disposals and scrappings - 35.1 - 35.1<br />
Disposals of operations - 0.4 - 0.4<br />
Amortization for the year - -8.5 - -8.5<br />
Reclassifications - -1.5 - -1.5<br />
Exchange rate differences for the year - 2.8 0.3 3.1<br />
Closing balance 31 Dec. <strong>2012</strong> -35.1 -93.3 -8,0 -136.5<br />
Carrying amounts<br />
As of 1 January 2011 3.5 22.1 3,159.4 3,185.0<br />
As of 31 December 2011 0.0 17.5 3,154.9 3,172.5<br />
As of 1 January <strong>2012</strong> - 17.5 3,154.9 3,172.5<br />
As of 31 December <strong>2012</strong> - 19.6 2,908.8 2,928.5<br />
Impairments for the year are included in the following items in the income statement for <strong>2012</strong> (SEKm): Cost of goods sold -8.5<br />
Impairments for the year are included in the following items in the income statement for 2011 (SEKm): Cost of goods sold -12.5<br />
All intangible assets, except goodwill, are amortized. For information on amortization, see the accounting principles detailed in Note 1.<br />
Impairment testing for cash generating units<br />
containing goodwill<br />
Group, SEKm <strong>2012</strong> 2011<br />
Goodwill amounts by cash generating unit:<br />
<strong>Inwido</strong> Sweden 991.3 991.3<br />
<strong>Inwido</strong> Nordic 1,718.8 1,772.7<br />
<strong>Inwido</strong> Europe 82.1 81.4<br />
Supply* 116.6 309.5<br />
Total 2,908.8 3,154.9<br />
Value in use by cash generating unit:<br />
<strong>Inwido</strong> Sweden 1,506.3 2,255.5<br />
<strong>Inwido</strong> Nordic 2,635.7 2,895.3<br />
<strong>Inwido</strong> Europe 271.7 287.1<br />
Supply* 299.2 595.8<br />
Total 4,712.9 6,033.7<br />
* The impairment testing of Supply in 2011 also included the unit<br />
Home Improvement, which was divested in <strong>2012</strong>.<br />
Key variables Assessment method<br />
Market<br />
growth<br />
Purchasing<br />
of goods<br />
and services<br />
Personnel<br />
costs and<br />
efficiency<br />
Expected market growth is based on a transition<br />
from the current competitive situation to the expected<br />
long-term growth trend. The forecast includes the<br />
strategy to increase the proportion of sales generated<br />
within the consumer segment, increased demand<br />
for energy-efficient products and the expected<br />
demographic trend. The forecast agrees with previous<br />
experience and external sources of information.<br />
The forecast for purchasing costs is based on<br />
expected inflation, changes in choice of material,<br />
volume advantages and other synergies within<br />
the Group. The forecast agrees with previous<br />
experience and forecasts.<br />
Forecast personnel costs are based on expected<br />
wage increases, planned efficiency measures and<br />
other synergies within the Group. The forecast<br />
agrees with previous experience and forecasts.<br />
70<br />
<strong>Inwido</strong> AB | <strong>Annual</strong> <strong>Report</strong> <strong>2012</strong>