Lakes and Watercourses
Lakes and Watercourses
Lakes and Watercourses

Create successful ePaper yourself
Turn your PDF publications into a flip-book with our unique Google optimized e-Paper software.
16<br />
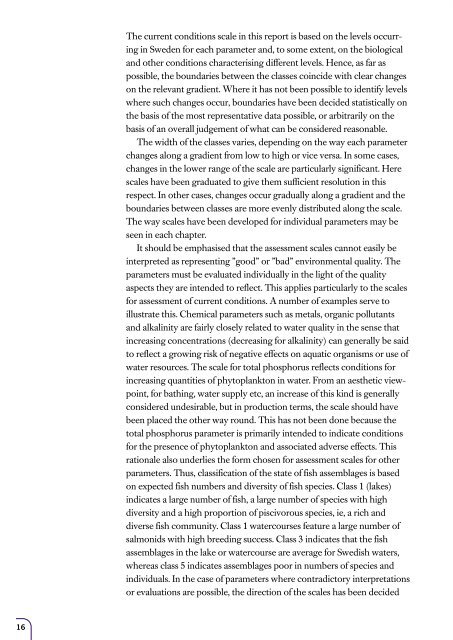
The current conditions scale in this report is based on the levels occurring<br />
in Sweden for each parameter <strong>and</strong>, to some extent, on the biological<br />
<strong>and</strong> other conditions characterising different levels. Hence, as far as<br />
possible, the boundaries between the classes coincide with clear changes<br />
on the relevant gradient. Where it has not been possible to identify levels<br />
where such changes occur, boundaries have been decided statistically on<br />
the basis of the most representative data possible, or arbitrarily on the<br />
basis of an overall judgement of what can be considered reasonable.<br />
The width of the classes varies, depending on the way each parameter<br />
changes along a gradient from low to high or vice versa. In some cases,<br />
changes in the lower range of the scale are particularly significant. Here<br />
scales have been graduated to give them sufficient resolution in this<br />
respect. In other cases, changes occur gradually along a gradient <strong>and</strong> the<br />
boundaries between classes are more evenly distributed along the scale.<br />
The way scales have been developed for individual parameters may be<br />
seen in each chapter.<br />
It should be emphasised that the assessment scales cannot easily be<br />
interpreted as representing ”good” or ”bad” environmental quality. The<br />
parameters must be evaluated individually in the light of the quality<br />
aspects they are intended to reflect. This applies particularly to the scales<br />
for assessment of current conditions. A number of examples serve to<br />
illustrate this. Chemical parameters such as metals, organic pollutants<br />
<strong>and</strong> alkalinity are fairly closely related to water quality in the sense that<br />
increasing concentrations (decreasing for alkalinity) can generally be said<br />
to reflect a growing risk of negative effects on aquatic organisms or use of<br />
water resources. The scale for total phosphorus reflects conditions for<br />
increasing quantities of phytoplankton in water. From an aesthetic viewpoint,<br />
for bathing, water supply etc, an increase of this kind is generally<br />
considered undesirable, but in production terms, the scale should have<br />
been placed the other way round. This has not been done because the<br />
total phosphorus parameter is primarily intended to indicate conditions<br />
for the presence of phytoplankton <strong>and</strong> associated adverse effects. This<br />
rationale also underlies the form chosen for assessment scales for other<br />
parameters. Thus, classification of the state of fish assemblages is based<br />
on expected fish numbers <strong>and</strong> diversity of fish species. Class 1 (lakes)<br />
indicates a large number of fish, a large number of species with high<br />
diversity <strong>and</strong> a high proportion of piscivorous species, ie, a rich <strong>and</strong><br />
diverse fish community. Class 1 watercourses feature a large number of<br />
salmonids with high breeding success. Class 3 indicates that the fish<br />
assemblages in the lake or watercourse are average for Swedish waters,<br />
whereas class 5 indicates assemblages poor in numbers of species <strong>and</strong><br />
individuals. In the case of parameters where contradictory interpretations<br />
or evaluations are possible, the direction of the scales has been decided


![Accommodation booking form [PDF]](https://img.yumpu.com/39471785/1/184x260/accommodation-booking-form-pdf.jpg?quality=85)