Lakes and Watercourses
Lakes and Watercourses
Lakes and Watercourses

You also want an ePaper? Increase the reach of your titles
YUMPU automatically turns print PDFs into web optimized ePapers that Google loves.
The concentration of base cations in limed lakes must be determined<br />
on the basis of reliable readings taken prior to liming or by calculating the<br />
calcium concentration from the magnesium content of the water <strong>and</strong> the<br />
Ca/Mg ratio in nearby, similar but unlimed waters. The latter alternative<br />
presupposes that limestone containing no magnesium (ie, limestone<br />
containing little dolomite) has been used for liming.<br />
If present alkalinity is less than 0.01 meq/l, the alkalinity ratio derived<br />
above cannot be used as a basis for classifying deviation. Instead, a<br />
modified alkalinity ratio can be estimated as shown below.<br />
alk < –0.01 –0.01< alk < 0.01 alk ≥ 0.01<br />
alk o > 0.01 0.25 (–0.01 /alk) (0.01/alk o ) (0.01/alk o ) 2 –100 (0.01 – alk) alk/alk o<br />
–0,01< alk o < 0.01 (–0.01 /alk) 2 –100 (alk o + 0.01)<br />
2 –100 (alk o – alk)<br />
alk o < –0.01<br />
alk o /alk<br />
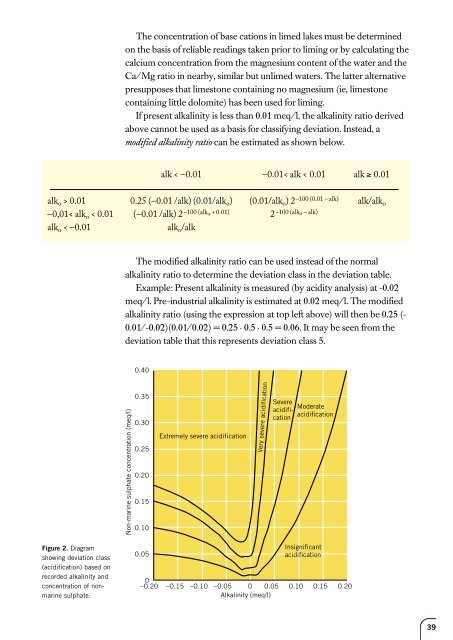
The modified alkalinity ratio can be used instead of the normal<br />
alkalinity ratio to determine the deviation class in the deviation table.<br />
Example: Present alkalinity is measured (by acidity analysis) at -0.02<br />
meq/l. Pre-industrial alkalinity is estimated at 0.02 meq/l. The modified<br />
alkalinity ratio (using the expression at top left above) will then be 0.25 (-<br />
0.01/-0.02)(0.01/0.02) = 0.25 · 0.5 · 0.5 = 0.06. It may be seen from the<br />
deviation table that this represents deviation class 5.<br />
0.40<br />
Non-marine sulphate concentration (meq/l)<br />
0.35<br />
0.30<br />
0.25<br />
0.20<br />
0.15<br />
0.10<br />
Extremely severe acidification<br />
Very severe acidification<br />
Severe<br />
Moderate<br />
acidification<br />
acidification<br />
Figure 2. Diagram<br />
showing deviation class<br />
(acidification) based on<br />
recorded alkalinity <strong>and</strong><br />
concentration of nonmarine<br />
sulphate.<br />
0.05<br />
Insignificant<br />
acidification<br />
0<br />
–0.20 –0.15 –0.10 –0.05 0 0.05 0.10 0.15 0.20<br />
Alkalinity (meq/l)<br />
39


![Accommodation booking form [PDF]](https://img.yumpu.com/39471785/1/184x260/accommodation-booking-form-pdf.jpg?quality=85)