Lakes and Watercourses
Lakes and Watercourses
Lakes and Watercourses

You also want an ePaper? Increase the reach of your titles
YUMPU automatically turns print PDFs into web optimized ePapers that Google loves.
from fields in lowl<strong>and</strong> areas <strong>and</strong> class 5 represents leaching from cultivated<br />
s<strong>and</strong>y soils, often combined with manure use.<br />
Since nitrogen losses over fairly large agricultural areas exceed 16 kg<br />
N/ha, there is reason to make particular note of areas where nitrogen<br />
losses are extreme (over 32 kg N/ha, year). This is particularly called for<br />
when setting priorities for remedial measures.<br />
The different classes are matched by various flow-weighted annual<br />
mean concentrations, depending on the flow per unit surface area. Figure 1<br />
shows the correlations between area-specific loss <strong>and</strong> concentration at<br />
four different levels of flow per unit surface area.<br />
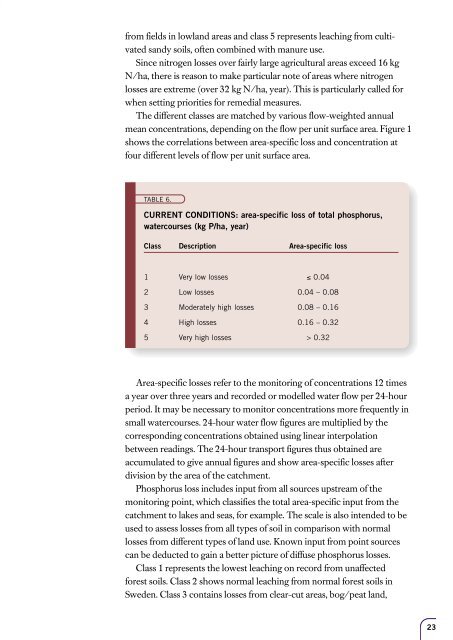
TABLE 6.<br />
CURRENT CONDITIONS: area-specific loss of total phosphorus,<br />
watercourses (kg P/ha, year)<br />
Class Description Area-specific loss<br />
1 Very low losses ≤ 0.04<br />
2 Low losses 0.04 – 0.08<br />
3 Moderately high losses 0.08 – 0.16<br />
4 High losses 0.16 – 0.32<br />
5 Very high losses > 0.32<br />
Area-specific losses refer to the monitoring of concentrations 12 times<br />
a year over three years <strong>and</strong> recorded or modelled water flow per 24-hour<br />
period. It may be necessary to monitor concentrations more frequently in<br />
small watercourses. 24-hour water flow figures are multiplied by the<br />
corresponding concentrations obtained using linear interpolation<br />
between readings. The 24-hour transport figures thus obtained are<br />
accumulated to give annual figures <strong>and</strong> show area-specific losses after<br />
division by the area of the catchment.<br />
Phosphorus loss includes input from all sources upstream of the<br />
monitoring point, which classifies the total area-specific input from the<br />
catchment to lakes <strong>and</strong> seas, for example. The scale is also intended to be<br />
used to assess losses from all types of soil in comparison with normal<br />
losses from different types of l<strong>and</strong> use. Known input from point sources<br />
can be deducted to gain a better picture of diffuse phosphorus losses.<br />
Class 1 represents the lowest leaching on record from unaffected<br />
forest soils. Class 2 shows normal leaching from normal forest soils in<br />
Sweden. Class 3 contains losses from clear-cut areas, bog/peat l<strong>and</strong>,<br />
23


![Accommodation booking form [PDF]](https://img.yumpu.com/39471785/1/184x260/accommodation-booking-form-pdf.jpg?quality=85)