Lakes and Watercourses
Lakes and Watercourses
Lakes and Watercourses

Create successful ePaper yourself
Turn your PDF publications into a flip-book with our unique Google optimized e-Paper software.
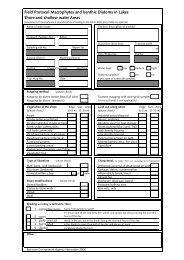
TABLE 46.<br />
DEVIATION from reference value, lakes. For the time being, calculations should only be<br />
made for lakes below 500 m above sea level. Background data on higher altitude lakes is<br />
too limited for reliable assessment. Calculations are only made for lakes that can be<br />
assumed to contain, or have contained, fish.<br />
Class Description Recorded value/reference value<br />
No. of species 1 Species diversity 1 Biomass 1 Number 1<br />
1 No or insignif. deviation > 0.80 > 1.00 0.65 – 1.50 0.60 – 1.40<br />
2 Slight deviation 0.62 – 0.80 0.83 – 1.00 0.45 – 0.65 or 0.37 – 0.60 or<br />
1.50 – 2.15 1.40 – 2.15<br />
3 Significant deviation 0.42 – 0.62 0.60 – 0.83 0.28 – 0.45 or 0.22 – 0.37 or<br />
2.15 – 2.70 2.15 – 2.80<br />
4 Large deviation 0.32 – 0.42 0.38 – 0.60 0.10 – 0.28 or 0.10 – 0.22 or<br />
2.70 – 3.40 2.80 – 3.50<br />
5 Very large deviation ≤ 0.32 ≤ 0.38 < 0.10 or < 0.10 or<br />
> 3.40 > 3.50<br />
Class Description Recorded value/reference value<br />
Proportion pisc. 1 Proportion Proportion Proportion<br />
cyprinids 1 species <strong>and</strong> tolerant<br />
stages sensitive species 3<br />
to acidification 2<br />
1 No or insignificant deviation 1.00 1.00 a) < 0.10<br />
2 Slight deviation 0.65 – 1.00 1.00 – 1.28 0.10 – 0.25<br />
3 Significant deviation 0.40 – 0.65 1.28 – 1.67 b) 0.25 – 0.50<br />
4 Large deviation 0.23 – 0.40 1.67 – 1.89 0.50 – 1.00<br />
5 Very large deviation < 0.23 > 1.89 c) 1.00<br />
Class Description Proportion alien species 4 Overall index 5<br />
1 No or insignificant deviation 0 ≤ 1.7<br />
2 Slight deviation 0 – 0.10 1.7 – 2.1<br />
3 Significant deviation 0.10 – 0.20 2.1 – 2.6<br />
4 Large deviation 0.20 – 0.50 2.6 – 3.0<br />
5 Very large deviation > 0.50 > 3.0<br />
1 The deviation is calculated as the ratio between recorded value <strong>and</strong> the reference value. The reference<br />
value is set with reference to Table 47.<br />
2 a) Presence of spined loach (Cobitis taenia) or crayfish or juvenile roach (Rutilus rutilus), minnow<br />
(Phoxinus phoxinus), burbot (Lota lota), char (Salvelinidae), whitefish (Coregonidae) or vendace<br />
(Coregonus albula).<br />
b) Presence of perch (Perca fluviatilis), trout (Salmo trutta), bullhead (Cottidae), ruffe (Gymnocephalus<br />
cernuus), burbot (Lota lota), grayling (Thymalus thymalus) char, whitefish or vendace (Coregonus albula).<br />
c) Species absent (have disappeared) or only mature/large individual specimens of perch or pike are<br />
present.<br />
3 Calculated as percentage by weight of crucian carp (Carassius carassius) <strong>and</strong>/or tench (Tinca tinca) out<br />
of the total catch. This parameter is only used in lakes where one of these species has been caught.<br />
4 Calculated as percentage by weight of fish species not native to Sweden out of the total catch.<br />
5 The overall assessment of deviation is obtained by calculating the mean class value for all parameters<br />
included (maximum 9 parameters).<br />
76


![Accommodation booking form [PDF]](https://img.yumpu.com/39471785/1/184x260/accommodation-booking-form-pdf.jpg?quality=85)