Lakes and Watercourses
Lakes and Watercourses
Lakes and Watercourses

Create successful ePaper yourself
Turn your PDF publications into a flip-book with our unique Google optimized e-Paper software.
This classification is based on an overall assessment taking account of the<br />
concentrations occurring in Swedish lakes at various degrees of human<br />
impact.<br />
Recorded concentration represents the mean value over three years<br />
for the period May – October. By using 3-year mean values for August<br />
alone, account must be taken of the element of uncertainty introduced.<br />
Reference values can be calculated or estimated in a number of ways.<br />
They can be estimated on the basis of historical studies of the area in<br />
question or studies of similar but unaffected lakes in the vicinity. However,<br />
phosphorus concentrations in some acidified lakes may be lower<br />
than the original level. In the absence of other data, reference values can<br />
be calculated using the correlation between total phosphorus <strong>and</strong><br />
coloured organic matter:<br />
TP ref (µg P/l) = 5 + 48 · abs f 420/5<br />
This function gives minimum observed values at a given absorbency <strong>and</strong>,<br />
generally speaking, a higher degree of deviation. In some cases, the extent<br />
of deviation may be estimated to be up to one class higher than in reality.<br />
Clear mountain waters are a case in point. The function has been derived<br />
from environmental monitoring programme data where series of at least<br />
five years have been available. Taking account of the element of uncertainty<br />
introduced, absorbency (abs f 420/5 ) can be calculated by multiplying<br />
water colour (mg Pt/l) by 0.002.<br />
In some limed or acidified lakes the ratio of recorded concentration to<br />
reference value may be less than 1, which may indicate oligotrophication,<br />
ie, a shift towards a more nutrient-poor state. Conditions of this kind<br />
should be particularly noted so as to allow further study of possible<br />
acidification-related effects.<br />
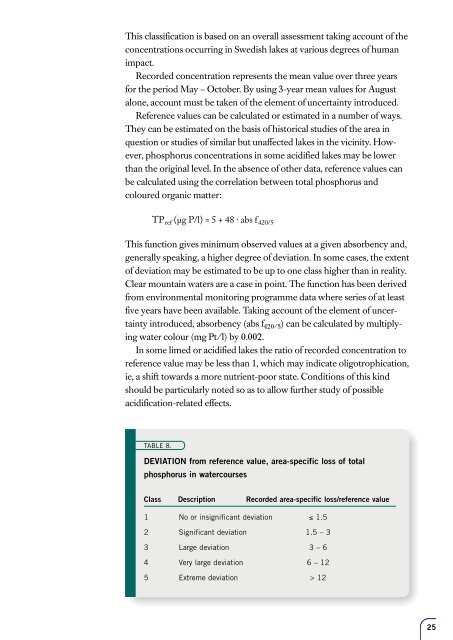
TABLE 8.<br />
DEVIATION from reference value, area-specific loss of total<br />
phosphorus in watercourses<br />
Class Description Recorded area-specific loss/reference value<br />
1 No or insignificant deviation ≤ 1.5<br />
2 Significant deviation 1.5 – 3<br />
3 Large deviation 3 – 6<br />
4 Very large deviation 6 – 12<br />
5 Extreme deviation > 12<br />
25


![Accommodation booking form [PDF]](https://img.yumpu.com/39471785/1/184x260/accommodation-booking-form-pdf.jpg?quality=85)