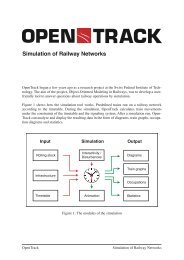
Download PDF-File - OpenTrack
Download PDF-File - OpenTrack
Download PDF-File - OpenTrack

Create successful ePaper yourself
Turn your PDF publications into a flip-book with our unique Google optimized e-Paper software.
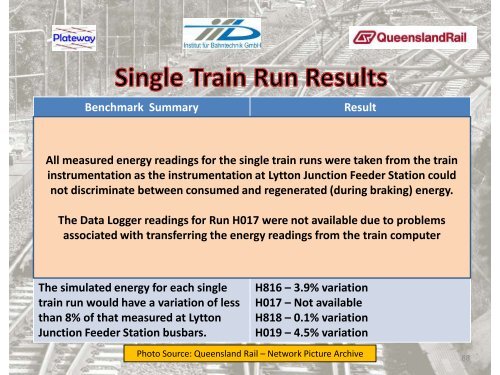
Benchmark Summary<br />
Operate instrumented test trains from<br />
Park Road to Cleveland & return<br />
(approx. 3 return trips with the first trip<br />
for calibration purposes)<br />
Result<br />
H816 – All stations PKR to CNV (wet)<br />
H017 – All stations CNV to MNY then<br />
express to PKR (wet)<br />
H818 – Express PKR to MNY then all<br />
stations to CNV (dry)<br />
H019 – All stations CNV to PKR (dry)<br />
All measured energy readings for the single train runs were taken from the train<br />
instrumentation as the instrumentation at Lytton Junction Feeder Station could<br />
not discriminate between consumed and regenerated (during braking) energy.<br />
Maximum The Data variation Logger between readings for actual Run H017 H816 were – not 23s available maximum due deviation to problems<br />
and simulated associated train with run transferring times to be the less energy H017 readings – 22s maximum from the train variation computer<br />
than 2 minutes<br />
H818 – 14s maximum variation<br />
H019 – 17s maximum variation<br />
The simulated energy for each single<br />
train run would have a variation of less<br />
than 8% of that measured at Lytton<br />
Junction Feeder Station busbars.<br />
H816 – 3.9% variation<br />
H017 – Not available<br />
H818 – 0.1% variation<br />
H019 – 4.5% variation<br />
Photo Source: Queensland Rail – Network Picture Archive<br />
88